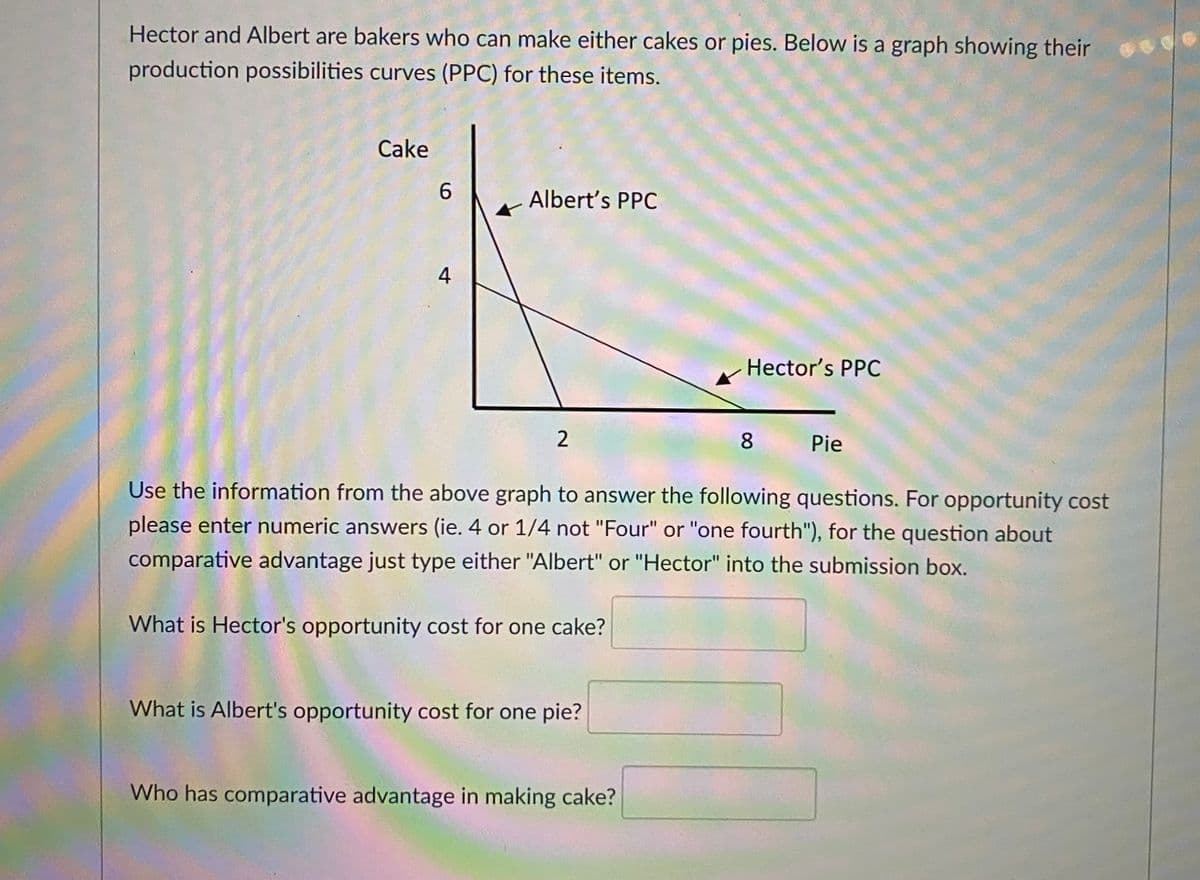
Hector and Albert are bakers who can make either cakes or pies. Below is a graph showing their production possibilities curves (PPC) for these items. Cake Albert's PPC 4 Hector's PPC 2 8 Pie Use the information from the above graph to answer the following questions. For opportunity cost please enter numeric answers (ie. 4 or 1/4 not "Four" or "one fourth"), for the question about comparative advantage just type either "Albert" or "Hector" into the submission box. What is Hector's opportunity cost for one cake? What is Albert's opportunity cost for one pie? Who has comparative advantage in making cake?
Q: Suppose Poland produces only tablets and smartphones. The resources that are used in the production…
A: Production Possibility Frontier (PPF) illustrates the combination of two goods that a nation can…
Q: Consider a simple exchange economy with two people: Bob and Jake. Bob and Jake both have 10 hours of…
A: a) Absolute advantage depends on the highest productivity per hour as the hours are the same for…
Q: (also known as the production possibilities curve) for alfalfa, an agricultural good, and cars, a…
A: A production possibility curve (PPC) shows the maximum possible output combinations of two goods or…
Q: ich of the following would be true in a typical PPF curve? The resources needed to make both goods…
A: The production possibility frontier shows the different combination of two goods that can be…
Q: The four people listed below are the only workers In an economy that works 10 hours per day and only…
A: Production possibility frontier shows various combinations of amounts of two goods that the country…
Q: Suppose South Africa produces two types of goods: alfalfa and construction vehicles. The following…
A: A production possibility frontier depicts the maximum amount of goods and services that an economy…
Q: On the following graph, use the blue line (circle symbol) to plot Felix's production possibilities…
A: Absolute advantage refers to the ability of an individual to produce more of the good than the other…
Q: 150 100 50 PPF 80 160 240 320 400 480 WHEAT (Millions of bushels) CARS (Tho
A:
Q: Steve can bake either 4 loaves of bread or 12 dozen cookies a day. Stew can bake either 4 loaves of…
A: A production possibility frontier (PPF) shows the maximum possible output combinations of two goods…
Q: Explain why a movement from a point inside a production possibilities frontier to the production…
A: The points on production possibilities frontier indicate the combination of two goods that are…
Q: Explain what is illustrated by the production possibilities frontier. Also, why is a production…
A: Production possibility frontier shows the combination of production of two different goods at a…
Q: Suppose Spain produces two types of goods: agricultural and capital. The following diagram shows its…
A: Given the information: Number of goods produced = 2 Agricultural goods = Alfalfa Captial goods =…
Q: Consider the production possibilities frontier (PPF) shown in the graph below to answer the next…
A: Production possibilities frontier shows the combinations of two goods that an economy can produce…
Q: • Use the data from the table below to construct correctly labeled side-by-side graphs showing the…
A: Microeconomics refers to the branch of mainstream economics that studies the behavior of individuals…
Q: Suppose that there are 10 million workers in Japan and that each of these workers can produce either…
A: Given that there are 10 million workers in Japan and that each of these workers can produce either 2…
Q: What does the shape of the PPF curve drawn suggest about the opportunity cost of producing ONE more…
A: A production possibility curve is a graph that depicts the many combinations of two items that can…
Q: Using the graph of a production possibilities frontier (PPF) below, please answer the questions that…
A: The production possibility frontier (PPF) is a business analysis curve that represents the…
Q: If the production possibilities frontier can be expressed as 4X2+y2=16, then the point X=√3; Y+2 is…
A: Given, PPF: 4X2+ Y2 = 16 X = √3, Y = 2
Q: What is comparative advantage? Give an example. Why does it make sense for economies to specialize…
A: We’ll answer the first question since the exact one wasn’t specified. Please submit a new question…
Q: The following graph shows the production possibilities frontier (PPF) of an economy that produces…
A: Opportunity cost is the forgone profit that the producer would have gained if he had selected the…
Q: The following graph shows the production possibilities curve (PPC) of an economy that produces…
A: Opportunity Cost is the cost or value of doing something or of choosing an alternative. It can be…
Q: One company produces only 2 goods: pillows and blankets and its PPF is represented in the graph…
A: Since we only answer up to 3 sub-parts, we’ll answer the first 3. Please resubmit the question and…
Q: Suppose there are two individuals, Casey and Rick, who live in a very simplified world where only…
A: Opportunity cost (OC) of one good (commodity) in terms of other is the units of production of…
Q: Brian and Crystal are farmers. Each one owns an 18-acre plot of land. The following table shows the…
A: Brian and Crystal are farmers. Each one owns an 18-acre plot of land. From the table given, Brian…
Q: Suppose that, on the basis of a nation’s production possibilities curve, an economy must sacrifice…
A: Comparative advantage refers to a situation wherein the country (say X) specializes in the…
Q: Suppose there are two bakers in town: Sarah and Amy. Sarah can bake 4 loaves of bread or 8 pies in…
A: In microeconomic theory, opportunity cost is the loss of the benefit that could have been enjoyed if…
Q: During the summer you have made the decision to attend summer school, which prevents you from…
A: "Since you have asked multiple questions, we will solve first question for you .. If you want any…
Q: Suppose Spain produces two types of goods: agricultural and capital. The following diagram shows its…
A: Given: Types of goods produced: Alfafa, Agricultural good Locomotives, capital good
Q: Question attahed in image
A: Two economic agents engage in voluntary trade with each other by exploiting each other's comparative…
Q: Question: How much more coffee does Todd gain from specialization and trade? To answer this…
A: Given information Todd uses 12 hours to produce chocolate and coffee He can produce 80 pounds of…
Q: Suppose a society called Atlantis faces the production possibilities curve (PPC) as given below. a)…
A: Production possibility curve: - it is the graphical representation of different combinations of two…
Q: Suppose that Maldonia and Lamponia agree to trade. Each country focuses its resources on producing…
A: A country having a lower cost of opportunity when compared to its partners of trading is known to…
Q: g. If the two countries decided to produce corn and peanut together as one business, draw the…
A: Alpha has a comparative advantage in the production of peanuts and Beta has a comparative advantage…
Q: Justin has 5 days in a work week; each day he can create either 2 Android apps or 1 Apple app.…
A:
Q: Suppose Bulgaria produces only tablets and cars. The resources that are used in the production of…
A: Production possibility frontier shows the various combination of 2 goods that can be produced by the…
Q: Suppose that in an hour Chip can gather 8 pounds of fruit or 4 pounds of nuts. In an hour, Monk can…
A: An economic entity or nation is said to have a comparative advantage in the production of a good or…
Q: Hecksher-Ohlin Model Mexico and Brazil each make t-shirts and televisions. The two countries have…
A: Hecksher-Ohlin Model The model states that the country will export that good which comparatively…
Q: omework (Ch 02) 4. Shifts in production possibilities Suppose Ireland produces two types of goods:…
A: The production potential frontier is a graphic depiction of the ideal production balance between two…
Q: Observe given PPC/PPF diagram and answer the question below: PPF Which of the following statements…
A: The economics refer to the study of allocation of scarce resources in the most optimal way when the…
Q: Robin and Betty can each pick mangoes and oranges. The following table summarises the time it takes…
A: Absolute advantage refers to the situation where one party can produce the same amount of goods and…
Q: Suppose there are two individuals, Casey and Rick, who live in a very simplified world where only…
A: When comparing the opportunity cost of both person, Casey have to give up 4.00 kg of rice for…
Q: Suppose there are 2 goods, waffles and donuts (doughnuts, if you're fancy). Further suppose that it…
A: Production possibilities frontier shows different combinations of two goods that can be produced…
Q: The following graph shows the production possibilities curve (PPC) of an economy that produces…
A: PPC shows combinations of two outputs that can be produced with the given level of resources and…
Q: Shen and Valerie are farmers. Each one owns a 20-acre plot of land. The following table shows the…
A: The given table is showing the quantity of corn and rye produced by Shen and Valerie using of an…
Q: Consider a simple exchange economy with two people: Bob and Jake. Bob and Jake both have ten hours…
A: PPF, Production possibilities frontier shows different combinations of two goods that can be…
Q: Refer to the figure below of Mindy and Patrick's PPF's. Which of the following statements is true?…
A: Production Possibility Frontier (PPF) is the combination of the resources that can be used to…
Q: • Use the data from the table below to construct correctly labeled side-by-side graphs showing the…
A: Microeconomics refers to the branch of mainstream economics that studies the behavior of individuals…
Q: Question: How much more coffee does Todd gain from specialization and trade? To answer this…
A: Given Before specialization, Todd produces 80 pounds of chocolates in 8 hours and 80 pounds of…
Q: An economy. produces 2 goods, computers and cell phones. Show graphically and explain how an…
A: When an economy produces 2 goods, computers and cell phones and there is improvement in technology…
Trending now
This is a popular solution!
Learn your way
Includes step-by-step video
Step by step
Solved in 2 steps
- Joe likes to snack. Suppose that Joe gets only one snack per day. Use the table below to indicate (1) which snack he will choose and (2) the opportunity costs of that decision (measured in utils). Snack Utils Received Chicken Breast 34 Pepperoni 24 Cheese 36 BBQ Chicken 30 Chicken Strips 26Sam is a skilled toy maker who is able to produce both cars and balls. He has 8 hours a day to produce toys. The following table shows the daily output resulting from various possible combinations of his time. Choice Hours Producing Produced (Cars) (Balls) (Cars) (Balls) A 8 0 4 0 B 6 2 3 8 C 4 4 2 14 D 2 6 1 16 E 0 8 0 17 On the following graph, use the blue points (circle symbol) to plot Sam's initial production possibilities frontier (PPF). Initial PPFNew PPF012345678302520151050BALLSCARS Suppose Sam is currently using combination D, producing one car per day. His opportunity cost of producing a second car per day is per day. Now, suppose Sam is currently using combination C, producing two cars per day. His opportunity cost of producing a third car per day is per day. From the previous analysis, you can determine that as Sam increases his production of cars, his opportunity cost of producing one more car .…Jane has 11 liters of soft drinks and 10 sandwiches. Bob, on the other hand, has 9 liters of soft drinks and 10 sandwiches. With these endowments, Jane's marginal rate of substitution (MRS) of soft drinks for sandwiches is 6 and Bob's MRS is equal to 8. Draw an Edgeworth box diagram to show whether this allocation of resources is efficient. If it is explain why. If it is not, what changes will make both parties better off? Part 2 1.) Using the three-point curved line drawing tool, draw an indifference curve for Jane when consuming 11 liters of soft drinks and 10 sandwiches. Label this curve UJ. 2.) Using the three-point curved line drawing tool, draw an indifference curve for Bob when consuming 9 liters of soft drinks and 10 sandwiches. Label this curve UB.
- Beth is a skilled toy maker who is able to produce both boats and balls. She has 8 hours a day to produce toys. The following table shows the daily output resulting from various possible combinations of her time. Choice Hours Producing Produced (Boats) (Balls) (Boats) (Balls) A 8 0 4 0 B 6 2 3 12 C 4 4 2 17 D 2 6 1 19 E 0 8 0 20 On the following graph, use the blue points (circle symbol) to plot Beth's initial production possibilities frontier (PPF). Initial PPFNew PPF012345678302520151050BALLSBOATS Suppose Beth is currently using combination D, producing one boat per day. Her opportunity cost of producing a second boat per day is per day. Now, suppose Beth is currently using combination C, producing two boats per day. Her opportunity cost of producing a third boat per day is per day. From the previous analysis, you can determine that as Beth increases her production of boats, her opportunity cost of producing one…A recent newspaper circular advertised the following special on tires: “Buy three, get the fourth tire for free—limit one free tire per customer.” If a consumer has $360 to spend on tires and other goods and each tire usually sells for $40, how does this deal impact the consumer’s opportunity set? show graphically the buy three get the fourth freeConsider a simple exchange economy with two people: Bob and Jake. Bob and Jake both have ten hoursof time available. The can use their time to do one of two things: make pancakes or make hamburgers.Bob can make two hamburgers in an hour or one pancake in an hour. Jake can make three pancakes in anhour or two hamburgers in an hour. Use this information to answer the following questions:a.) Draw Jake and Bob’s PPFs, with hamburgers on the x-axis.b.) Give equations for Jake and Bob’s PPFs in y = mx+b form, still treating hamburgers as the xvariable.c.) Who has absolute advantage in the production of hamburgers? Who has absolute advantage inthe production of pancakes?d.) Who has comparative advantage in the production of hamburgers? Who has comparativeadvantage in the production of pancakes?e.) Can Bob and Jake both benefit from trade if the terms of trade are one pancake per hambruger?Why
- Suppose a small economy produces only two goods: apples and oranges. The production possibilities frontier (PPF) for this economy is given by the following equation: PPF: 5A + 3O = 60, where A represents the quantity of apples produced and O represents the quantity of oranges produced. Calculate the opportunity cost of producing one additional apple.Solve all the Questions:- Harold lives on Doritos and seafood salads. The price of Doritos is 1 dollar per bag and the price of seafood salads is 2 dollars each. Harold allows himself to spend no more than 11 dollars a day on food. He also restricts his consumption to 6,500 calories per day. There are 1,500 calories in a bag of Doritos and 500 calories in a seafood salad. If he spends his entire money budget each day and consumes no more calories than his calo-rie limit, he can consume up to a. 5 bag of Doritos per day but no more. b. 1 bag of Doritos per day but no more. c. 4 bag of seafood salad per day but no more. d. 3 bag of Doritos per day but no more. Quincy lives on pretzels and seafood salads. The price of pretzels is 1 dollar per bag and the price of seafood salads is 2 dollars each. Quincy allows himself to spend no more than 14 dollars a day on food. He also restricts his consumption to 3,400 calories per day. There are 600 calories in a bag…Use the following table to answer the question below. Dave's Production Possibilities Schedule Simon's Production Possibilities Schedule Pounds of Green Beans Pounds of Corn Pounds of Green Beans Pounds of Corn 0 160 0 80 20 120 40 60 40 80 80 40 60 40 120 20 80 0 160 0 Dave's opportunity cost of producing 1 pound of corn is ______ pound(s) of green beans. Simon's opportunity cost of producing 1 pound of corn is ______ pound(s) of green beans. Multiple Choice 1, 2 2, 1/2 1/2, 2 2, 1
- You’re given the following information about a newlywed couple Mike and Debbie. The table provides you with the time it takes each of them to do different chores: vacuuming a room or washing a load of dishes. Mike Vacuum 1 room = one hour 2 loads of laundry = one hour Debbie Vacuum 2 rooms = one hour 1 load of laundry = one hour What is Debbie's opportunity cost of washing a load of laundry in terms of vacuuming? Group of answer choices The ability to vacuum 2 rooms. The ability to vacuum 1/2 a room. The ability to vacuum 3 rooms. The ability to vacuum one room.what is the role of Recourses in individual economy? Please explain in minimum 500 wordsThe president of LeTall University, President John, spends $30 per week on pizzas (qz)and beers (qb). At LeTall Pizza, his go-to pizza joint, pizza costs $3 per slice and beeralso costs $3 per can. Assume fractions of the goods are allowed.(a) Draw President John’s budget line (qb on the horizontal and qz on the vertical axis).(b) President John receives a coupon from LeTall Pizza. The coupon, which will expirein a week, allows him to buy a can of beer at a discounted price of $1 per can. Itis, however, only good for a dozen cans of beer. Draw President John’s budget lineunder the coupon. Label any critical points on the budget line.(c) In another week, LeTall Pizza offers a special deal for pizza. For every half dozenslices of pizza bought during the week, one can get two additional slices for free.Draw President John’s budget line under the special deal. Label any critical pointson the budget line.