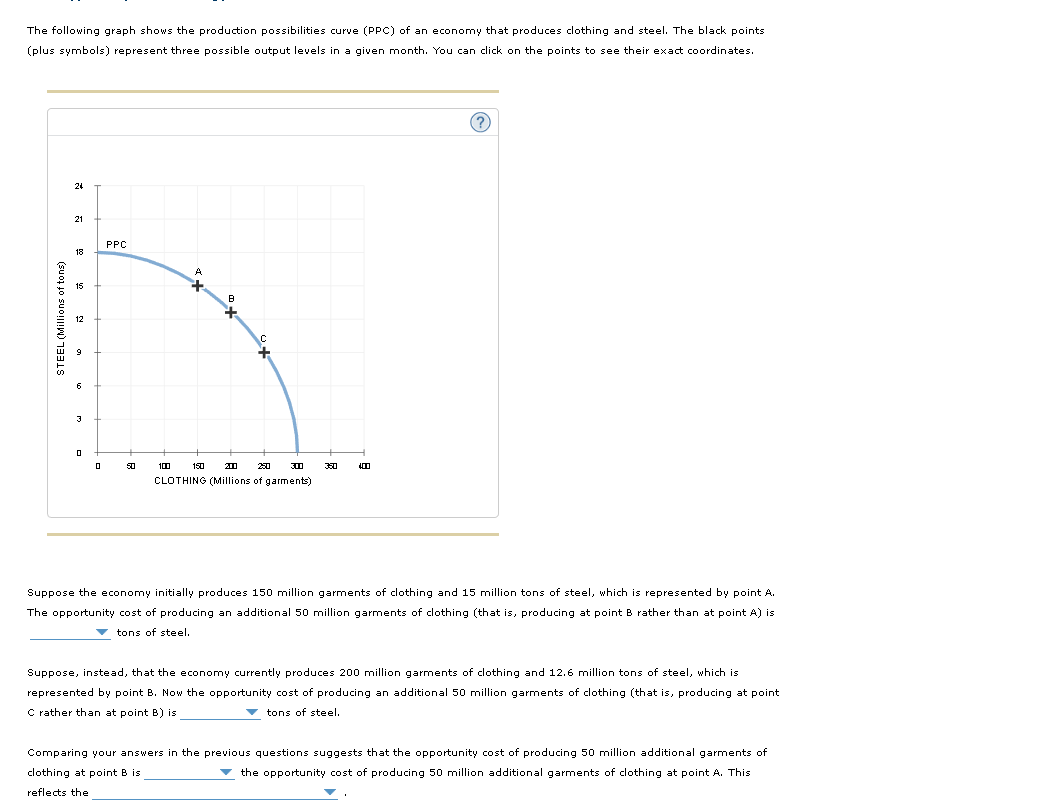
The following graph shows the production possibilities curve (PPC) of an economy that produces clothing and steel. The black points (plus symbols) represent three possible output levels in a given month. You can click on the points to see their exact coordinates. STEEL (Millions of tons) 24 21 15 12 6 3 0 0 PPC A + 100 150 + C 250 300 CLOTHING (Millions of garments) 3:30 4.00 (?) Suppose the economy initially produces 150 million garments of clothing and 15 million tons of steel, which is represented by point A. The opportunity cost of producing an additional 50 million garments of clothing (that is, producing at point B rather than at point A) is tons of steel. Suppose, instead, that the economy currently produces 200 million garments of clothing and 12.6 million tons of steel, which is represented by point B. Now the opportunity cost of producing an additional 50 million garments of clothing (that is, producing at point C rather than at point B) is ▼tons of steel. Comparing your answers in the previous questions suggests that the opportunity cost of producing 50 million additional garments of clothing at point B is the opportunity cost of producing 50 million additional garments of clothing at point A. This reflects the
The following graph shows the production possibilities curve (PPC) of an economy that produces clothing and steel. The black points (plus symbols) represent three possible output levels in a given month. You can click on the points to see their exact coordinates. STEEL (Millions of tons) 24 21 15 12 6 3 0 0 PPC A + 100 150 + C 250 300 CLOTHING (Millions of garments) 3:30 4.00 (?) Suppose the economy initially produces 150 million garments of clothing and 15 million tons of steel, which is represented by point A. The opportunity cost of producing an additional 50 million garments of clothing (that is, producing at point B rather than at point A) is tons of steel. Suppose, instead, that the economy currently produces 200 million garments of clothing and 12.6 million tons of steel, which is represented by point B. Now the opportunity cost of producing an additional 50 million garments of clothing (that is, producing at point C rather than at point B) is ▼tons of steel. Comparing your answers in the previous questions suggests that the opportunity cost of producing 50 million additional garments of clothing at point B is the opportunity cost of producing 50 million additional garments of clothing at point A. This reflects the

Chapter2: Productions Possibilities, Opportunity Costs, And Economic Growth
Section: Chapter Questions
Problem 8SQ

Related questions
Question
Comparing your answers in the previous questions suggests that the opportunity cost of producing 50 million additional garments of clothing at point B is______ (choose between these: less than, greater than or equal to).
and
the opportunity cost of producing 50 million additional garments of clothing at point A. This reflects the________ (choose between: notion that countries can
Transcribed Image Text:The following graph shows the production possibilities curve (PPC) of an economy that produces clothing and steel. The black points
(plus symbols) represent three possible output levels in a given month. You can click on the points to see their exact coordinates.
STEEL (Millions of tons)
24
21
3
0
0
PPC
50
201
250
300
CLOTHING (Millions of garments)
100
150
3:20
4.00
(?
Suppose the economy initially produces 150 million garments of clothing and 15 million tons of steel, which is represented by point A.
The opportunity cost of producing an additional 50 million garments of clothing (that is, producing at point B rather than at point A) is
tons of steel.
Suppose, instead, that the economy currently produces 200 million garments of clothing and 12.6 million tons of steel, which is
represented by point B. Now the opportunity cost of producing an additional 50 million garments of clothing (that is, producing at point
C rather than at point B) is
▼tons of steel.
Comparing your answers in the previous questions suggests that the opportunity cost of producing 50 million additional garments of
clothing at point B is
the opportunity cost of producing 50 million additional garments of clothing at point A. This
reflects the
Expert Solution
This question has been solved!
Explore an expertly crafted, step-by-step solution for a thorough understanding of key concepts.

This is a popular solution!

Trending now
This is a popular solution!

Step by step
Solved in 3 steps

Follow-up Questions
Read through expert solutions to related follow-up questions below.
Follow-up Question
So the last is it the fact that resources are scarce or law of increasing
Solution
Knowledge Booster


Learn more about
Need a deep-dive on the concept behind this application? Look no further. Learn more about this topic, economics and related others by exploring similar questions and additional content below.Recommended textbooks for you


Survey of Economics (MindTap Course List)
Economics
ISBN:
9781305260948
Author:
Irvin B. Tucker
Publisher:
Cengage Learning