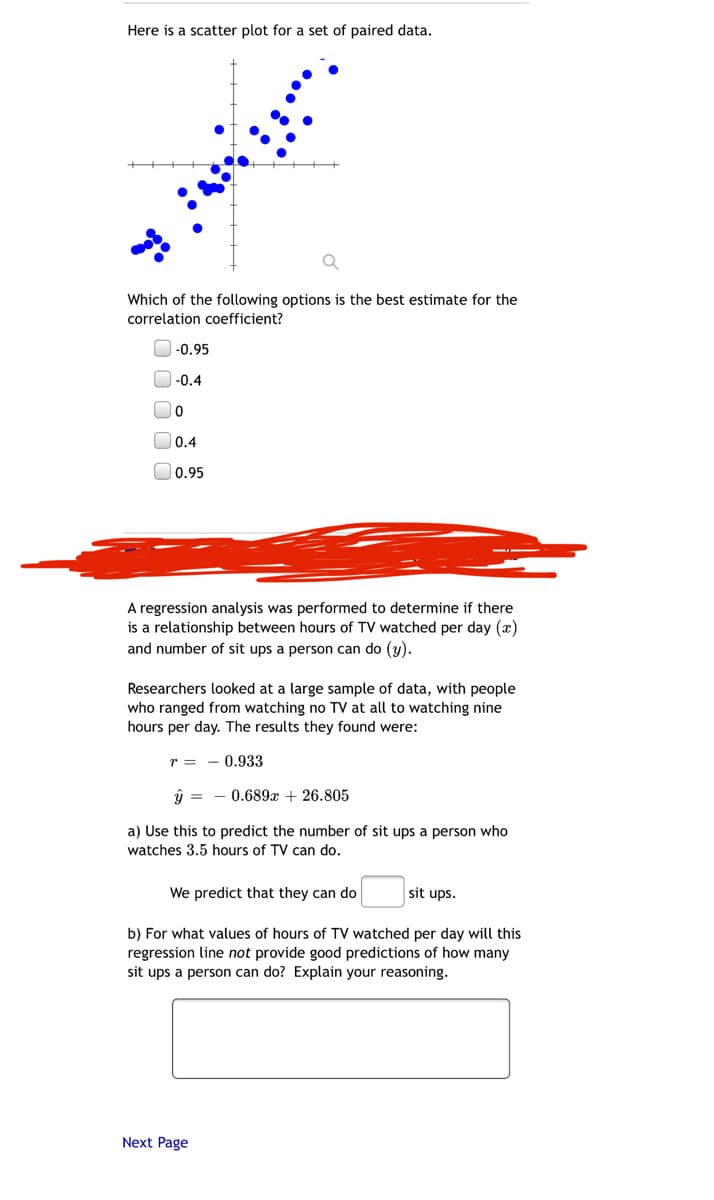
Here is a scatter plot for a set of paired data. Which of the following options is the best estimate for the correlation coefficient? -0.95 -0.4 O0.4 O0.95 A regression analysis was performed to determine if there is a relationship between hours of TV watched per day (x) and number of sit ups a person can do (y). Researchers looked at a large sample of data, with people who ranged from watching no TV at all to watching nine hours per day. The results they found were: r = - 0.933 0.689a + 26.805 a) Use this to predict the number of sit ups a person who watches 3.5 hours of TV can do. We predict that they can do sit ups. b) For what values of hours of TV watched per day will this regression line not provide good predictions of how many sit ups a person can do? Explain your reasoning.


Correlation
Correlation defines a relationship between two independent variables. It tells the degree to which variables move in relation to each other. When two sets of data are related to each other, there is a correlation between them.
Linear Correlation
A correlation is used to determine the relationships between numerical and categorical variables. In other words, it is an indicator of how things are connected to one another. The correlation analysis is the study of how variables are related.
Regression Analysis
Regression analysis is a statistical method in which it estimates the relationship between a dependent variable and one or more independent variable. In simple terms dependent variable is called as outcome variable and independent variable is called as predictors. Regression analysis is one of the methods to find the trends in data. The independent variable used in Regression analysis is named Predictor variable. It offers data of an associated dependent variable regarding a particular outcome.


Trending now
This is a popular solution!

Step by step
Solved in 2 steps


