a regression analysis on the following bivariate set of data with y as the response variable. X y 33.4 34.6 56.3 94.6 45.3 71.8 70.5 133.8 53.5 20.4 48.4 71.9 44.8 45.3 82.5 61 71.1 56.3 107.9 d the correlation coefficient and report it accurate to three decimal places. 81.5 33 74.2 108.8 48.1 at proportion of the variation in y can be explained by the variation in the values of x? Report answer as ercentage accurate to one decimal place. (If the answer is 0.84471, then it would be 84.5%...you would er 84.5 without the percent symbol.) %6 X + ed on the data, calculate the regression line (each value to three decimal places) dict what value (on average) for the response variable will be obtained from a value of 53.3 as the lanatory variable. Use a significance level of a = 0.05 to assess the strength of the linear correlation. at is the predicted response value? (Report answer accurate to one decimal place.)
a regression analysis on the following bivariate set of data with y as the response variable. X y 33.4 34.6 56.3 94.6 45.3 71.8 70.5 133.8 53.5 20.4 48.4 71.9 44.8 45.3 82.5 61 71.1 56.3 107.9 d the correlation coefficient and report it accurate to three decimal places. 81.5 33 74.2 108.8 48.1 at proportion of the variation in y can be explained by the variation in the values of x? Report answer as ercentage accurate to one decimal place. (If the answer is 0.84471, then it would be 84.5%...you would er 84.5 without the percent symbol.) %6 X + ed on the data, calculate the regression line (each value to three decimal places) dict what value (on average) for the response variable will be obtained from a value of 53.3 as the lanatory variable. Use a significance level of a = 0.05 to assess the strength of the linear correlation. at is the predicted response value? (Report answer accurate to one decimal place.)

Chapter4: Linear Functions
Section: Chapter Questions
Problem 30PT: For the following exercises, use Table 4 which shows the percent of unemployed persons 25 years or...

Related questions
Question
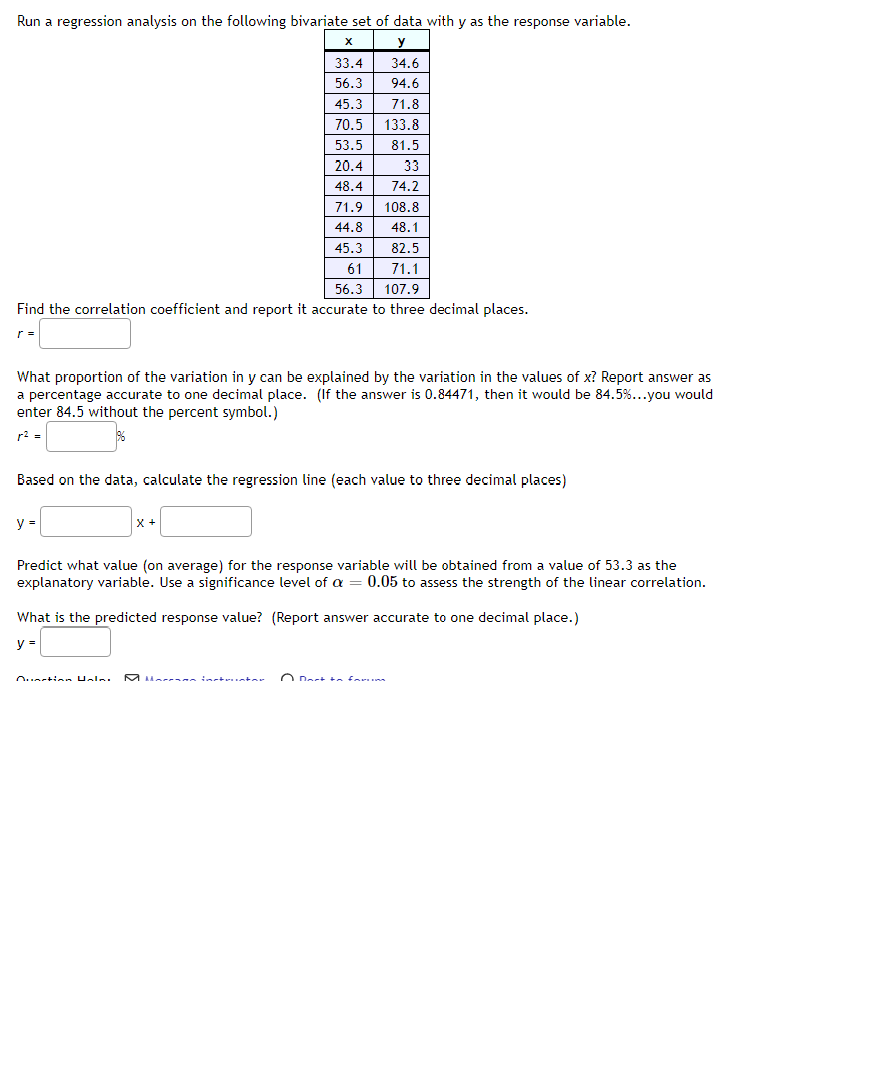
Transcribed Image Text:Run a regression analysis on the following bivariate set of data with y as the response variable.
X
y
33.4
34.6
56.3
94.6
45.3
71.8
70.5
133.8
53.5 81.5
20.4
33
48.4
74.2
71.9 108.8
44.8
48.1
82.5
71.1
56.3
107.9
Find the correlation coefficient and report it accurate to three decimal places.
What proportion of the variation in y can be explained by the variation in the values of x? Report answer as
a percentage accurate to one decimal place. (If the answer is 0.84471, then it would be 84.5%...you would
enter 84.5 without the percent symbol.)
r² =
86
Based on the data, calculate the regression line (each value to three decimal places)
y =
45.3
61
X +
Predict what value (on average) for the response variable will be obtained from a value of 53.3 as the
explanatory variable. Use a significance level of a = 0.05 to assess the strength of the linear correlation.
Ounction Halni
What is the predicted response value? (Report answer accurate to one decimal place.)
y =
O Dort to fanim
Expert Solution
This question has been solved!
Explore an expertly crafted, step-by-step solution for a thorough understanding of key concepts.

This is a popular solution!

Trending now
This is a popular solution!

Step by step
Solved in 2 steps with 2 images

Recommended textbooks for you

Glencoe Algebra 1, Student Edition, 9780079039897…
Algebra
ISBN:
9780079039897
Author:
Carter
Publisher:
McGraw Hill

Functions and Change: A Modeling Approach to Coll…
Algebra
ISBN:
9781337111348
Author:
Bruce Crauder, Benny Evans, Alan Noell
Publisher:
Cengage Learning
Glencoe Algebra 1, Student Edition, 9780079039897…
Algebra
ISBN:
9780079039897
Author:
Carter
Publisher:
McGraw Hill
Functions and Change: A Modeling Approach to Coll…
Algebra
ISBN:
9781337111348
Author:
Bruce Crauder, Benny Evans, Alan Noell
Publisher:
Cengage Learning