(HINT: The mean of the sample is 96 spots, standard deviation of the sample is 21 spots, n = 101, claim = 101 spots) d. Shall we use a t or z test statistic for this situation…and why? e. What is the test statistic in this case? How exactly is it computed? f. What is the approximate p-value associated with this test statistic?
Unitary Method
The word “unitary” comes from the word “unit”, which means a single and complete entity. In this method, we find the value of a unit product from the given number of products, and then we solve for the other number of products.
Speed, Time, and Distance
Imagine you and 3 of your friends are planning to go to the playground at 6 in the evening. Your house is one mile away from the playground and one of your friends named Jim must start at 5 pm to reach the playground by walk. The other two friends are 3 miles away.
Profit and Loss
The amount earned or lost on the sale of one or more items is referred to as the profit or loss on that item.
Units and Measurements
Measurements and comparisons are the foundation of science and engineering. We, therefore, need rules that tell us how things are measured and compared. For these measurements and comparisons, we perform certain experiments, and we will need the experiments to set up the devices.
2. "Dalmatian Darnation," by Kathy Sparling
A greedy dog breeder named Spreckles , Bred puppies with numerous freckles
The Dalmatians he sought, Possessed spot upon spot
The more spots, he thought, the more shekels.
His competitors did not agree, That freckles would increase the fee.
They said, “Spots are quite nice, But they don't affect price;
One should breed for improved pedigree.”
The breeders decided to prove, This strategy was a wrong move.
Breeding only for spots, Would wreak havoc, they thought.
His theory they want to disprove.
They proposed a contest to Spreckles, Comparing dog prices to freckles.
In records they looked up, One hundred one pups:
Dalmatians that fetched the most shekels.
They asked Mr. Spreckles to name, An average spot count he'd claim
To bring in big bucks. Said Spreckles, “Well, shucks,
It's for one hundred one that I aim.”
Said an amateur statistician, Who wanted to help with this mission.
“Twenty-one for the sample, Standard deviation's ample:
They examined one hundred and one, Dalmatians that fetched a good sum.
They counted each spot, Mark, freckle and dot
And tallied up every one.
Instead of one hundred one spots, They averaged ninety six dots
Can they muzzle Spreckles’, Obsession with freckles
Based on all the dog data they've got?
(HINT: The mean of the sample is 96 spots, standard deviation of the sample is 21 spots, n = 101, claim = 101 spots)
d. Shall we use a t or z test statistic for this situation…and why?
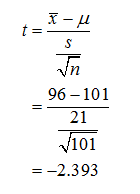
e. What is the test statistic in this case? How exactly is it computed?
f. What is the approximate p-value associated with this test statistic?
d.
This is a left tailed test.
Since we do not know the population standard deviation we use student’s t-distribution for this test.
e.
It is given that x-bar = 96.
Sample standard deviation, s = 21
Population mean, µ is 101.
Sample standard deviation, s= 0.06.
Sample size, n is 101.
The test statistic value can be obtained as follows:

Step by step
Solved in 2 steps with 1 images


