Historical and Industry Average Ratios HTS Software , Inc. Industry 2011 Ratio 2010 2011 Current Ratio 2.6 2.7 1.8 1.75 Quick Ratio Inventory Turnover Average Collection Period Total Asset Tumover 4.5 4.7 40days 42 days 1.2 1 Debt Ratio 20% 21% Times Interest Eamed 8.9 43% Gross Profit Margin Operating Profit Margin Net Profit Margin 44% 30% 32% 20% 21% Retum on total assets 12% 13% Retum on Equity Price/Eamings Ratio 15% 16% 7.3
Historical and Industry Average Ratios HTS Software , Inc. Industry 2011 Ratio 2010 2011 Current Ratio 2.6 2.7 1.8 1.75 Quick Ratio Inventory Turnover Average Collection Period Total Asset Tumover 4.5 4.7 40days 42 days 1.2 1 Debt Ratio 20% 21% Times Interest Eamed 8.9 43% Gross Profit Margin Operating Profit Margin Net Profit Margin 44% 30% 32% 20% 21% Retum on total assets 12% 13% Retum on Equity Price/Eamings Ratio 15% 16% 7.3

Chapter1: Financial Statements And Business Decisions
Section: Chapter Questions
Problem 1Q

Related questions
Question
You are provided with the Income Statement and the Balance Sheet of HTS software, Inc. for 2011.Required: (a) Calculate the ratios stated in the table below for HTS Software, Inc. for 2011 (b) Analyze the current financial position for the company from a time series and cross section viewpoint. (c) Break your analysis into an evaluation of the firm’s liquidity, activity, debt, profitability and market ratios.
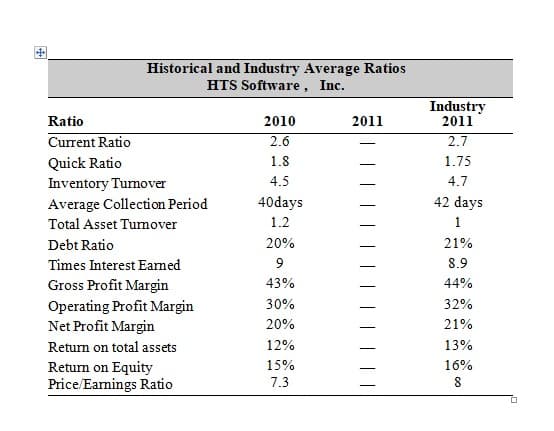
Transcribed Image Text:Historical and Industry Average Ratios
HTS Software , Inc.
Industry
2011
Ratio
2010
2011
Current Ratio
2.6
2.7
1.75
Quick Ratio
Inventory Turnover
1.8
4.5
4.7
Average Collection Period
40days
42 days
Total Asset Tumover
1.2
1
Debt Ratio
20%
21%
Times Interest Eamed
9
8.9
Gross Profit Margin
43%
44%
30%
32%
Operating Profit Margin
Net Profit Margin
20%
21%
Retum on total assets
12%
13%
Return on Equity
Price/Eamings Ratio
15%
16%
7.3
8
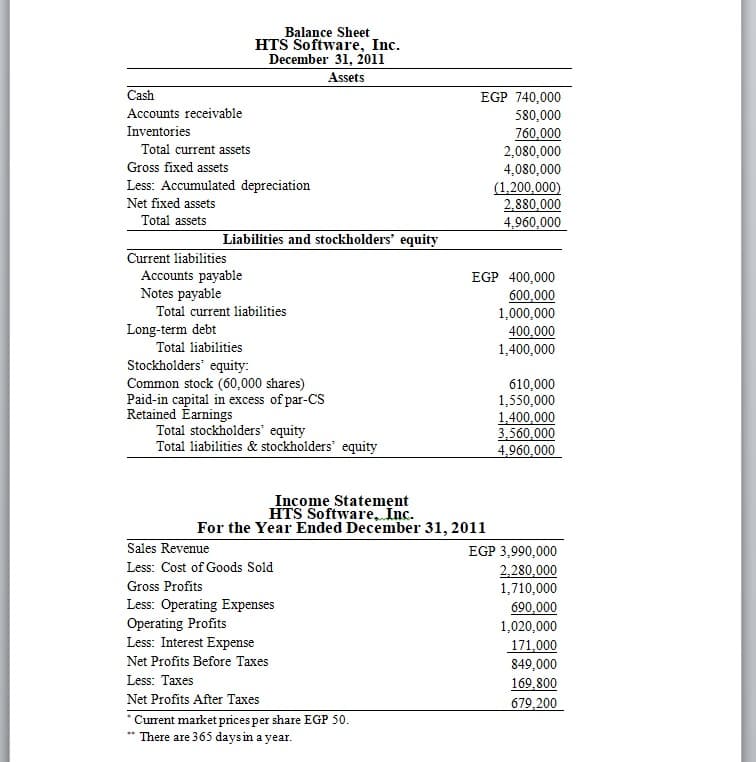
Transcribed Image Text:Balance Sheet
HTS Software, Inc.
December 31, 2011
Assets
Cash
EGP 740,000
Accounts receivable
580,000
760,000
2,080,000
Inventories
Total current assets
Gross fixed assets
Less: Accumulated depreciation
Net fixed assets
4,080,000
(1,200,000)
2,880,000
4,960,000
Total assets
Liabilities and stockholders' equity
Current liabilities
Accounts payable
Notes payable
Total current liabilities
Long-term debt
EGP 400,000
600,000
1,000,000
400,000
1,400,000
Total liabilities
Stockholders' equity:
Common stock (60,000 shares)
Paid-in capital in excess of par-CS
Retained Earnings
Total stockholders' equity
Total liabilities & stockholders' equity
610,000
1,550,000
1,400,000
3,560,000
4,960,000
Income Statement
HTS Software, Inc.
For the Year Ended December 31, 2011
Sales Revenue
EGP 3,990,000
2,280,000
1,710,000
Less: Cost of Goods Sold
Gross Profits
Less: Operating Expenses
Operating Profits
Less: Interest Expense
690,000
1,020,000
171,000
Net Profits Before Taxes
849,000
Less: Taxes
169,800
Net Profits After Taxes
679,200
* Current market prices per share EGP 50.
There are 365 days in a year.
Expert Solution
This question has been solved!
Explore an expertly crafted, step-by-step solution for a thorough understanding of key concepts.

This is a popular solution!

Trending now
This is a popular solution!

Step by step
Solved in 2 steps with 1 images

Knowledge Booster


Learn more about
Need a deep-dive on the concept behind this application? Look no further. Learn more about this topic, accounting and related others by exploring similar questions and additional content below.Recommended textbooks for you

Accounting
Accounting
ISBN:
9781337272094
Author:
WARREN, Carl S., Reeve, James M., Duchac, Jonathan E.
Publisher:
Cengage Learning,

Accounting Information Systems
Accounting
ISBN:
9781337619202
Author:
Hall, James A.
Publisher:
Cengage Learning,
Accounting
Accounting
ISBN:
9781337272094
Author:
WARREN, Carl S., Reeve, James M., Duchac, Jonathan E.
Publisher:
Cengage Learning,
Accounting Information Systems
Accounting
ISBN:
9781337619202
Author:
Hall, James A.
Publisher:
Cengage Learning,

Horngren's Cost Accounting: A Managerial Emphasis…
Accounting
ISBN:
9780134475585
Author:
Srikant M. Datar, Madhav V. Rajan
Publisher:
PEARSON

Intermediate Accounting
Accounting
ISBN:
9781259722660
Author:
J. David Spiceland, Mark W. Nelson, Wayne M Thomas
Publisher:
McGraw-Hill Education

Financial and Managerial Accounting
Accounting
ISBN:
9781259726705
Author:
John J Wild, Ken W. Shaw, Barbara Chiappetta Fundamental Accounting Principles
Publisher:
McGraw-Hill Education