Photos, Postcards, Paintings Male Tourist Female Tourist Always Often Occasionally Rarely or never 16% 28% 31 27 35 22 29 12 Totals 100% 100% Source: H. Wilkins, “Souvenirs: What and Why We Buy," Journal of Travel Research, Vol. 50, No. 3, May 2011 (adapted from Table 2). a. Based on the percentages shown in the table, do you think male and female tourists differ in their responses to purchasing photographs, postcards, or paintings? Why are these percentages alone insufficient to draw a conclu- sion about the true response category proportions? b. Assume that 1,500 males and 1,700 females partici- pated in the survey. Use these sample sizes and the percentages in the table to compute the counts of tour- ists in each of the Response/Gender categories. This represents the contingency table for the study. c. Specify the null and alternative hypotheses for test- ing whether male and female tourists differ in their responses to purchasing photographs, postcards, or paintings.
Photos, Postcards, Paintings Male Tourist Female Tourist Always Often Occasionally Rarely or never 16% 28% 31 27 35 22 29 12 Totals 100% 100% Source: H. Wilkins, “Souvenirs: What and Why We Buy," Journal of Travel Research, Vol. 50, No. 3, May 2011 (adapted from Table 2). a. Based on the percentages shown in the table, do you think male and female tourists differ in their responses to purchasing photographs, postcards, or paintings? Why are these percentages alone insufficient to draw a conclu- sion about the true response category proportions? b. Assume that 1,500 males and 1,700 females partici- pated in the survey. Use these sample sizes and the percentages in the table to compute the counts of tour- ists in each of the Response/Gender categories. This represents the contingency table for the study. c. Specify the null and alternative hypotheses for test- ing whether male and female tourists differ in their responses to purchasing photographs, postcards, or paintings.

Glencoe Algebra 1, Student Edition, 9780079039897, 0079039898, 2018
18th Edition
ISBN:9780079039897
Author:Carter
Publisher:Carter
Chapter4: Equations Of Linear Functions
Section4.5: Correlation And Causation
Problem 11PPS

Related questions
Question
a, b, and c
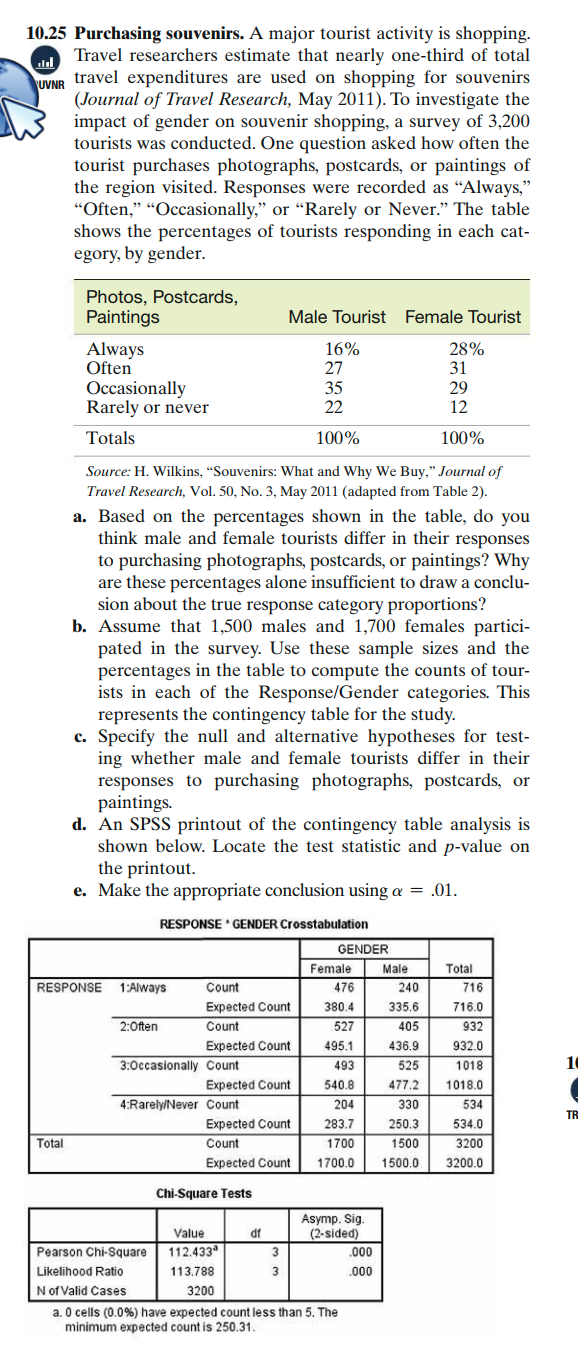
Transcribed Image Text:10.25 Purchasing souvenirs. A major tourist activity is shopping.
Travel researchers estimate that nearly one-third of total
UVNR travel expenditures are used on shopping for souvenirs
(Journal of Travel Research, May 2011). To investigate the
impact of gender on souvenir shopping, a survey of 3,200
tourists was conducted. One question asked how often the
tourist purchases photographs, postcards, or paintings of
the region visited. Responses were recorded as “Always,"
"Often," “Occasionally," or "Rarely or Never." The table
shows the percentages of tourists responding in each cat-
egory, by gender.
Photos, Postcards,
Paintings
Male Tourist Female Tourist
Always
Often
16%
27
28%
Occasionally
Rarely or never
35
22
31
29
12
Totals
100%
100%
Source: H. Wilkins, “Souvenirs: What and Why We Buy," Journal of
Travel Research, Vol. 50, No. 3, May 2011 (adapted from Table 2).
a. Based on the percentages shown in the table, do you
think male and female tourists differ in their responses
to purchasing photographs, postcards, or paintings? Why
are these percentages alone insufficient to draw a conclu-
sion about the true response category proportions?
b. Assume that 1,500 males and 1,700 females partici-
pated in the survey. Use these sample sizes and the
percentages in the table to compute the counts of tour-
ists in each of the Response/Gender categories. This
represents the contingency table for the study.
c. Specify the null and alternative hypotheses for test-
ing whether male and female tourists differ in their
responses to purchasing photographs, postcards, or
paintings.
d. An SPSS printout of the contingency table analysis is
shown below. Locate the test statistic and p-value on
the printout.
e. Make the appropriate conclusion using a = .01.
RESPONSE ' GENDER Crosstabulation
GENDER
Female
Male
Total
RESPONSE
1:Always
Count
476
240
716
Expected Count
380.4
335,6
716.0
2:0ften
Count
527
405
932
Expected Count
495.1
436.9
932.0
3:0ccasionally Count
493
525
1018
10
Expected Count
540.8
477.2
1018.0
4:Rarely/Never Count
204
330
534
TR
Expected Count
283,7
250.3
534.0
Total
Count
1700
1500
3200
Expected Count
1700.0
1500,0
3200.0
Chi-Square Tests
Asymp. Sig.
(2-sided)
Value
df
112.433
113.788
Pearson Chi-Square
.000
Likelihood Ratio
3
.000
Nof Valid Cases
3200
a. 0 cells (0.0%) have expected count less than 5. The
minimum expected count is 250.31.
Expert Solution
This question has been solved!
Explore an expertly crafted, step-by-step solution for a thorough understanding of key concepts.

This is a popular solution!

Trending now
This is a popular solution!

Step by step
Solved in 3 steps with 1 images

Recommended textbooks for you
Glencoe Algebra 1, Student Edition, 9780079039897…
Algebra
ISBN:
9780079039897
Author:
Carter
Publisher:
McGraw Hill

Holt Mcdougal Larson Pre-algebra: Student Edition…
Algebra
ISBN:
9780547587776
Author:
HOLT MCDOUGAL
Publisher:
HOLT MCDOUGAL
Glencoe Algebra 1, Student Edition, 9780079039897…
Algebra
ISBN:
9780079039897
Author:
Carter
Publisher:
McGraw Hill
Holt Mcdougal Larson Pre-algebra: Student Edition…
Algebra
ISBN:
9780547587776
Author:
HOLT MCDOUGAL
Publisher:
HOLT MCDOUGAL