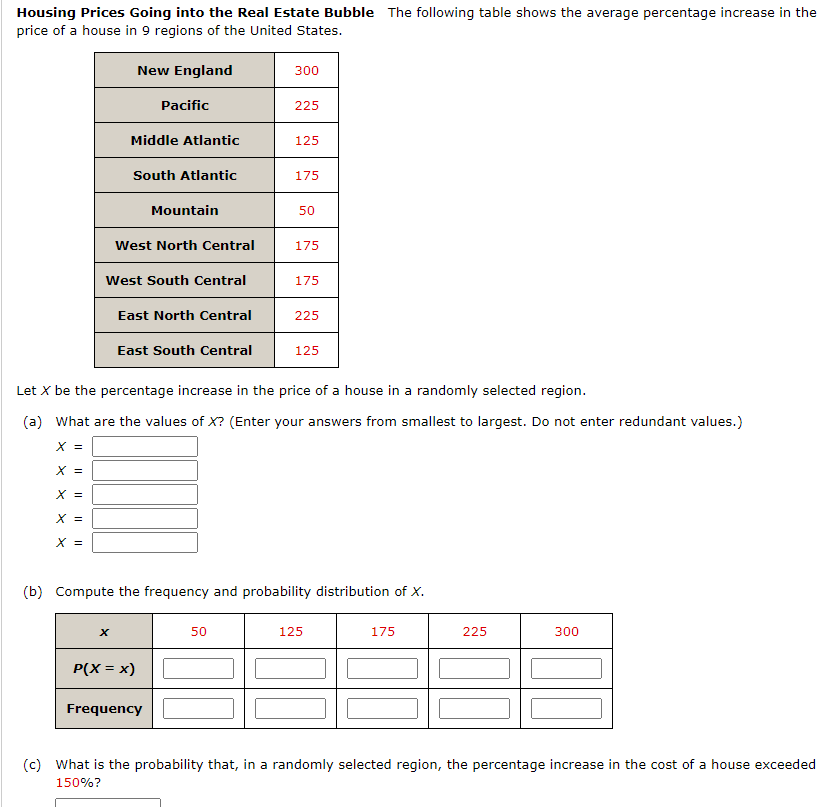
Housing Prices Going into the Real Estate Bubble The following table shows the average percentage increase in the price of a house in 9 regions of the United States. New England 300 Pacific 225 Middle Atlantic 125 South Atlantic 175 Mountain 50 West North Central 175 West South Central 175 East North Central 225 East South Central 125 Let X be the percentage increase in the price of a house in a randomly selected region. (a) What are the values of X? (Enter your answers from smallest to largest. Do not enter redundant values.) X = X = X = X = X = (b) Compute the frequency and probability distribution of X. 50 125 175 225 300 P(X = x) Frequency (c) What is the probability that, in a randomly selected region, the percentage increase in the cost of a house exceeded 150%?


Continuous Probability Distributions
Probability distributions are of two types, which are continuous probability distributions and discrete probability distributions. A continuous probability distribution contains an infinite number of values. For example, if time is infinite: you could count from 0 to a trillion seconds, billion seconds, so on indefinitely. A discrete probability distribution consists of only a countable set of possible values.
Normal Distribution
Suppose we had to design a bathroom weighing scale, how would we decide what should be the range of the weighing machine? Would we take the highest recorded human weight in history and use that as the upper limit for our weighing scale? This may not be a great idea as the sensitivity of the scale would get reduced if the range is too large. At the same time, if we keep the upper limit too low, it may not be usable for a large percentage of the population!


Trending now
This is a popular solution!

Step by step
Solved in 2 steps with 2 images


