How do you prove that the normally distributed assumption has been met for a Two Proportion z Test? Choose all assumptions which are appropriate. Residual plots have no pattern Scatterplots are linear Scatterplots have no pattern Normal Sampling Distribution: np 2 5 & n(1-p) > 5 Histograms are bell shaped Histograms are uniform Normal quantile plots are linear Residual plots are linear Modified boxplots have no outliers Modified boxplots have less than two outliers Normal quantile plots have no pattern Normal Sampling Distribution: n,p, 2 5, n,(1-p,) > 5, n.p, 2 5 & n,(1-P,) 2 5 Normal Sampling Distribution: all n's 2 30 or Populations are normally distributed
How do you prove that the normally distributed assumption has been met for a Two Proportion z Test? Choose all assumptions which are appropriate. Residual plots have no pattern Scatterplots are linear Scatterplots have no pattern Normal Sampling Distribution: np 2 5 & n(1-p) > 5 Histograms are bell shaped Histograms are uniform Normal quantile plots are linear Residual plots are linear Modified boxplots have no outliers Modified boxplots have less than two outliers Normal quantile plots have no pattern Normal Sampling Distribution: n,p, 2 5, n,(1-p,) > 5, n.p, 2 5 & n,(1-P,) 2 5 Normal Sampling Distribution: all n's 2 30 or Populations are normally distributed

Holt Mcdougal Larson Pre-algebra: Student Edition 2012
1st Edition
ISBN:9780547587776
Author:HOLT MCDOUGAL
Publisher:HOLT MCDOUGAL
Chapter11: Data Analysis And Probability
Section11.4: Collecting Data
Problem 2E

Related questions

Question
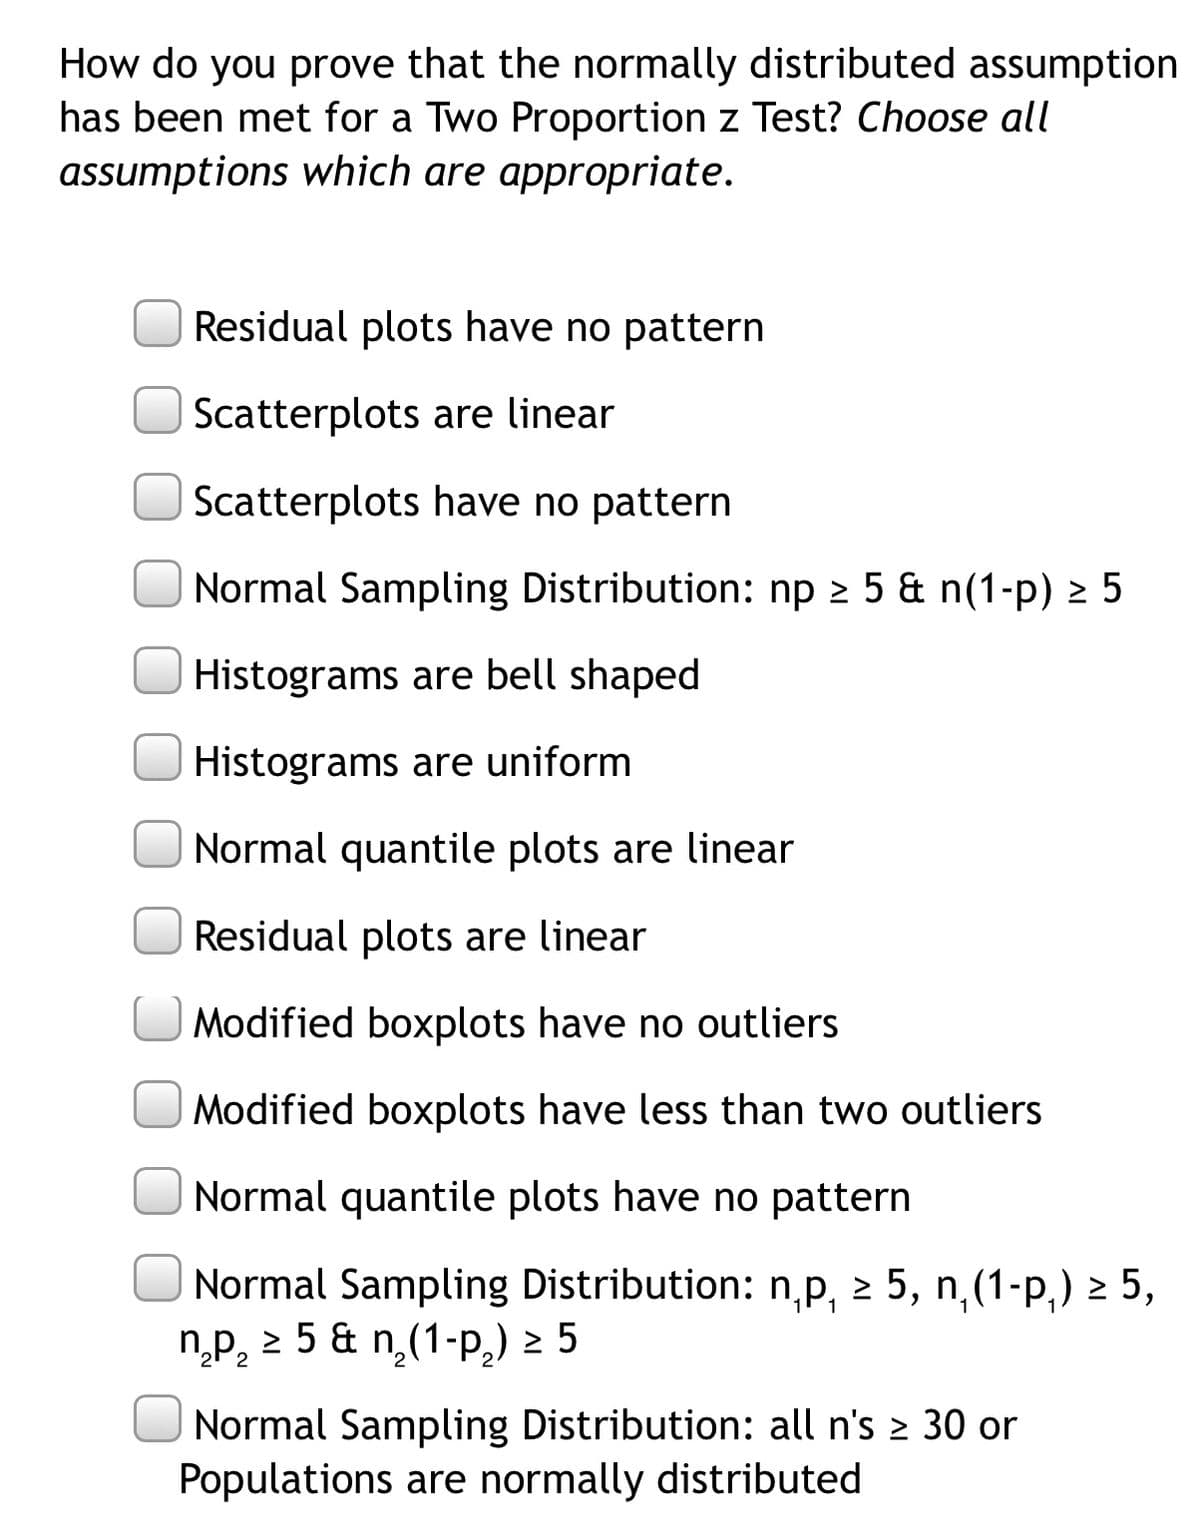
Transcribed Image Text:How do you prove that the normally distributed assumption
has been met for a Two Proportion z Test? Choose all
assumptions which are appropriate.
Residual plots have no pattern
Scatterplots are linear
Scatterplots have no pattern
Normal Sampling Distribution: np 2 5 & n(1-p) > 5
Histograms are bell shaped
Histograms are uniform
Normal quantile plots are linear
Residual plots are linear
O Modified boxplots have no outliers
Modified boxplots have less than two outliers
Normal quantile plots have no pattern
Normal Sampling Distribution: np, 2 5, n,(1-p,) > 5,
np, 2 5 & n,(1-p,) 2 5
Normal Sampling Distribution: all n's 2 30 or
Populations are normally distributed
Expert Solution
This question has been solved!
Explore an expertly crafted, step-by-step solution for a thorough understanding of key concepts.

This is a popular solution!

Trending now
This is a popular solution!

Step by step
Solved in 2 steps

Knowledge Booster


Learn more about
Need a deep-dive on the concept behind this application? Look no further. Learn more about this topic, statistics and related others by exploring similar questions and additional content below.Recommended textbooks for you
Holt Mcdougal Larson Pre-algebra: Student Edition…
Algebra
ISBN:
9780547587776
Author:
HOLT MCDOUGAL
Publisher:
HOLT MCDOUGAL

College Algebra (MindTap Course List)
Algebra
ISBN:
9781305652231
Author:
R. David Gustafson, Jeff Hughes
Publisher:
Cengage Learning
Holt Mcdougal Larson Pre-algebra: Student Edition…
Algebra
ISBN:
9780547587776
Author:
HOLT MCDOUGAL
Publisher:
HOLT MCDOUGAL
College Algebra (MindTap Course List)
Algebra
ISBN:
9781305652231
Author:
R. David Gustafson, Jeff Hughes
Publisher:
Cengage Learning