How the enumerated in the table below affects the demand and supply? Describe their impact with the help of the demand and supply curves (draw cases of shift/movement or put "ticks" in the cells, which characterize the effect of the change).
How the enumerated in the table below affects the demand and supply? Describe their impact with the help of the demand and supply curves (draw cases of shift/movement or put "ticks" in the cells, which characterize the effect of the change).

Chapter1: The Role And Method Of Economics
Section: Chapter Questions
Problem 9P

Related questions
Question

Transcribed Image Text:Task No 2
How the enumerated in the table below affects the
demand and supply? Describe their impact with the
help of the demand and supply curves (draw cases of
shift/movement or put "ticks" in the cells, which
characterize the effect of the change).
Table 1
Change (all other things Shift in the
being equal)
Shift in the
supply curve
Movement along the
supply curve
Movement
demand curve
along the
demand curve
|Change in consumer
incomes
Change in prices of
competing products
|Change in prices for
raw materials
|Change of fashion
goods
Introduction of new
technology
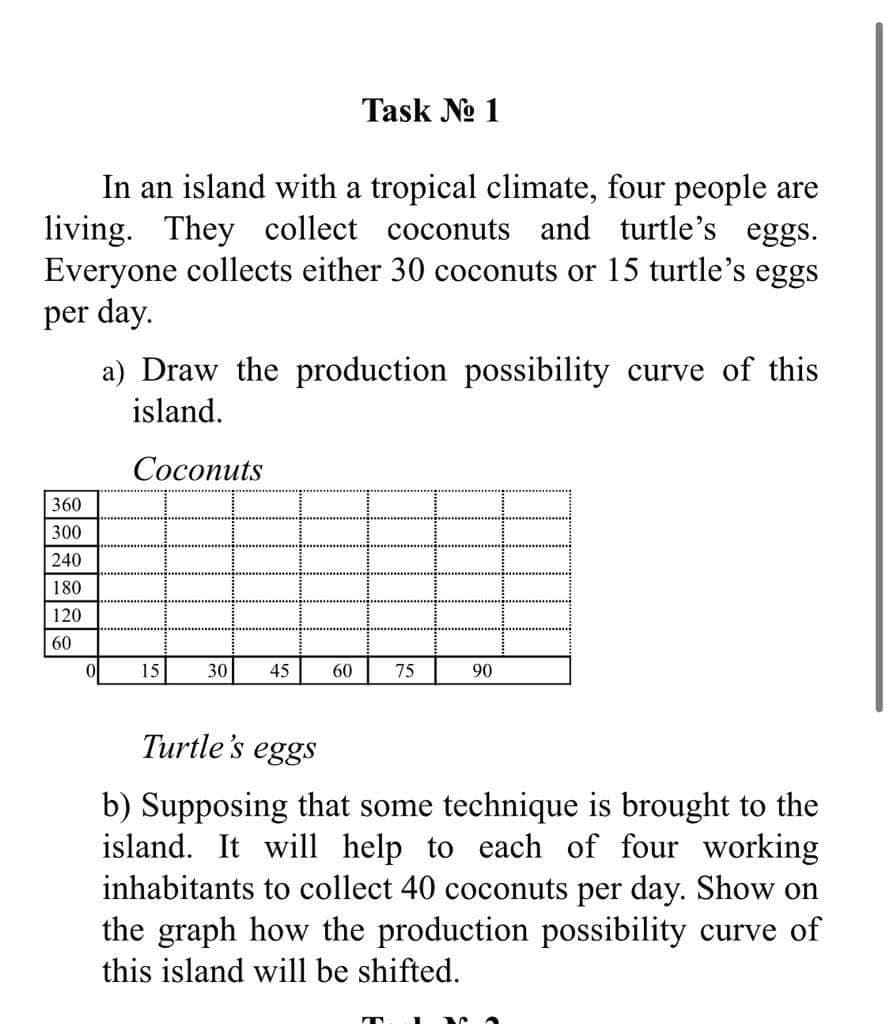
Transcribed Image Text:Task No 1
In an island with a tropical climate, four people are
living. They collect coconuts and turtle's eggs.
Everyone collects either 30 coconuts or 15 turtle's eggs
per day.
a) Draw the production possibility curve of this
island.
Сосоnuts
360
300
240
180
120
60
15
30
45
60
75
90
Turtle's eggs
b) Supposing that some technique is brought to the
island. It will help to each of four working
inhabitants to collect 40 coconuts per day. Show on
the graph how the production possibility curve of
this island will be shifted.
Expert Solution
This question has been solved!
Explore an expertly crafted, step-by-step solution for a thorough understanding of key concepts.

Step by step
Solved in 3 steps with 1 images

Knowledge Booster


Learn more about
Need a deep-dive on the concept behind this application? Look no further. Learn more about this topic, economics and related others by exploring similar questions and additional content below.Recommended textbooks for you
Exploring Economics
Economics
ISBN:
9781544336329
Author:
Robert L. Sexton
Publisher:
SAGE Publications, Inc

Principles of Economics 2e
Economics
ISBN:
9781947172364
Author:
Steven A. Greenlaw; David Shapiro
Publisher:
OpenStax
Exploring Economics
Economics
ISBN:
9781544336329
Author:
Robert L. Sexton
Publisher:
SAGE Publications, Inc
Principles of Economics 2e
Economics
ISBN:
9781947172364
Author:
Steven A. Greenlaw; David Shapiro
Publisher:
OpenStax