hydrophobic silica gel plates. He then placed each plate in separate developing chambers, one containing solvent system WHITE and the other housing solvent system MIX. Earth allowed the chromatograms to develop for around five minutes. Afterwards, he removed the plates from the containers and placed them inside an iodine chamber. The chromatograms resulting from the TLC experiment after visualization are illustrated as follows. The distances travelled by each spot and by the solvents were measured and recorded in the displayed table. 75.0 mm 10.5 mm 0 mm U B A WHITE 71.5 mm solvent front origin. 8 mm 0 mm. B MIX SOLVENT SYSTEM WHITE MIX SPOTS A B C D A B C D DISTANCE TRAVELLED FROM THE ORIGIN, mm 13.0 32.5 41.0 66.5 10.5 27.5 39.0 53.5
hydrophobic silica gel plates. He then placed each plate in separate developing chambers, one containing solvent system WHITE and the other housing solvent system MIX. Earth allowed the chromatograms to develop for around five minutes. Afterwards, he removed the plates from the containers and placed them inside an iodine chamber. The chromatograms resulting from the TLC experiment after visualization are illustrated as follows. The distances travelled by each spot and by the solvents were measured and recorded in the displayed table. 75.0 mm 10.5 mm 0 mm U B A WHITE 71.5 mm solvent front origin. 8 mm 0 mm. B MIX SOLVENT SYSTEM WHITE MIX SPOTS A B C D A B C D DISTANCE TRAVELLED FROM THE ORIGIN, mm 13.0 32.5 41.0 66.5 10.5 27.5 39.0 53.5

Chapter4: Least-squares And Calibration Methods
Section: Chapter Questions
Problem 3P

Related questions
Question
Compute for the Rf value
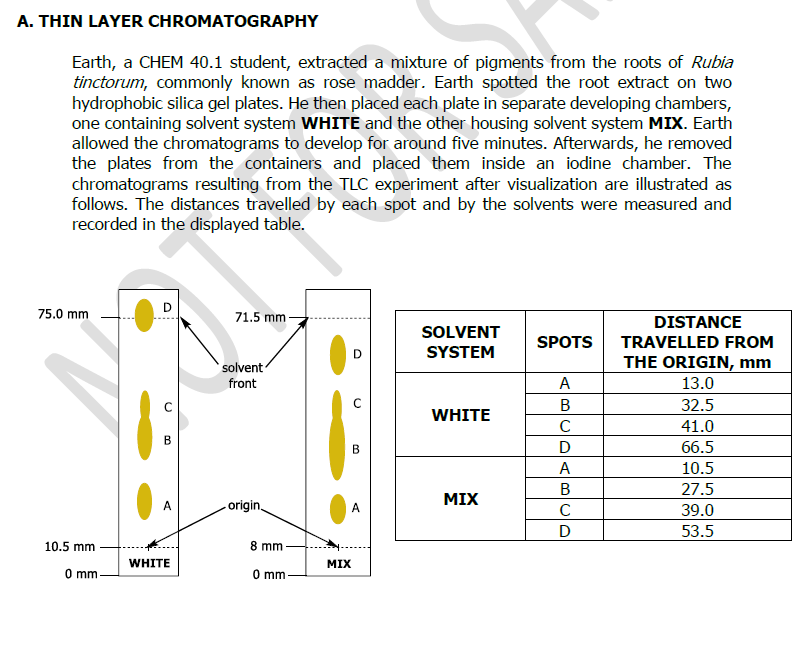
Transcribed Image Text:A. THIN LAYER CHROMATOGRAPHY
Earth, a CHEM 40.1 student, extracted a mixture of pigments from the roots of Rubia
tinctorum, commonly known as rose madder. Earth spotted the root extract on two
hydrophobic silica gel plates. He then placed each plate in separate developing chambers,
one containing solvent system WHITE and the other housing solvent system MIX. Earth
allowed the chromatograms to develop for around five minutes. Afterwards, he removed
the plates from the containers and placed them inside an iodine chamber. The
chromatograms resulting from the TLC experiment after visualization are illustrated as
follows. The distances travelled by each spot and by the solvents were measured and
recorded in the displayed table.
75.0 mm
10.5 mm
0 mm.
C
A
WHITE
71.5 mm
solvent
front
origin.
8 mm
0 mm
A
MIX
SOLVENT
SYSTEM
WHITE
MIX
SPOTS
A
B
C
D
A
B
C
D
DISTANCE
TRAVELLED FROM
THE ORIGIN, mm
13.0
32.5
41.0
66.5
10.5
27.5
39.0
53.5
Expert Solution
This question has been solved!
Explore an expertly crafted, step-by-step solution for a thorough understanding of key concepts.

Step by step
Solved in 4 steps with 3 images

Knowledge Booster


Learn more about
Need a deep-dive on the concept behind this application? Look no further. Learn more about this topic, chemistry and related others by exploring similar questions and additional content below.Recommended textbooks for you

Principles of Instrumental Analysis
Chemistry
ISBN:
9781305577213
Author:
Douglas A. Skoog, F. James Holler, Stanley R. Crouch
Publisher:
Cengage Learning

EBK A SMALL SCALE APPROACH TO ORGANIC L
Chemistry
ISBN:
9781305446021
Author:
Lampman
Publisher:
CENGAGE LEARNING - CONSIGNMENT
Principles of Instrumental Analysis
Chemistry
ISBN:
9781305577213
Author:
Douglas A. Skoog, F. James Holler, Stanley R. Crouch
Publisher:
Cengage Learning
EBK A SMALL SCALE APPROACH TO ORGANIC L
Chemistry
ISBN:
9781305446021
Author:
Lampman
Publisher:
CENGAGE LEARNING - CONSIGNMENT