Hypothetical problem A corn farmer produces 300 sacks of corn at 50 kgs./sack. • Prevailing price of corn/sack is P1,200. • He incurred the following annual expenses (P): • Fixed costs: land rent @5,000; irrigation fee@3,000; warehouse @2,500 insurance @3,000; interest on loan @4,200; entrepreneuship@7,000; salaries/wages@10,000; taxes@4,600; depreciation@2,600 Variable costs: seeds@5,000; fertilizer@10,500: labor@18,0003; pesticides@8,000; tractor@3,000; transportation,@3,500.
Hypothetical problem A corn farmer produces 300 sacks of corn at 50 kgs./sack. • Prevailing price of corn/sack is P1,200. • He incurred the following annual expenses (P): • Fixed costs: land rent @5,000; irrigation fee@3,000; warehouse @2,500 insurance @3,000; interest on loan @4,200; entrepreneuship@7,000; salaries/wages@10,000; taxes@4,600; depreciation@2,600 Variable costs: seeds@5,000; fertilizer@10,500: labor@18,0003; pesticides@8,000; tractor@3,000; transportation,@3,500.

Chapter1: Making Economics Decisions
Section: Chapter Questions
Problem 1QTC

Related questions
Question
Refer to the hypothetical problem and the instructions below. Make graphs. Do as indicated.
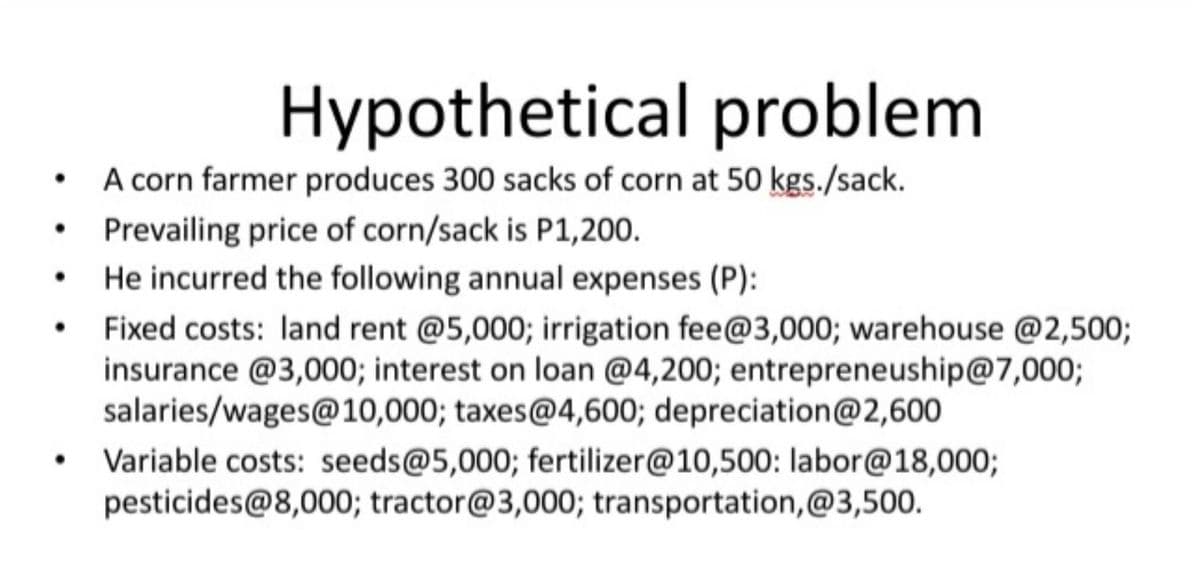
Transcribed Image Text:Hypothetical problem
A corn farmer produces 300 sacks of corn at 50 kgs./sack.
• Prevailing price of corn/sack is P1,200.
He incurred the following annual expenses (P):
Fixed costs: land rent @5,000; irrigation fee@3,000; warehouse @2,500;
insurance @3,000; interest on loan @4,200; entrepreneuship@7,000;
salaries/wages@10,000; taxes@4,600; depreciation@2,600
• Variable costs: seeds@5,000; fertilizer@10,500: labor@18,000;
pesticides@8,000; tractor@3,000; transportation,@3,500.
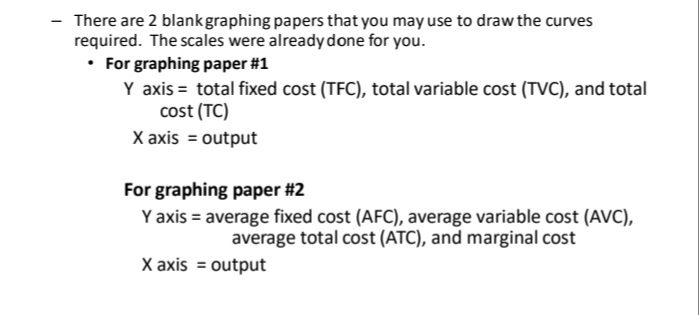
Transcribed Image Text:There are 2 blankgraphing papers that you may use to draw the curves
required. The scales were already done for you.
• For graphing paper #1
Y axis = total fixed cost (TFC), total variable cost (TVC), and total
cost (TC)
%3D
X axis = output
For graphing paper #2
Y axis = average fixed cost (AFC), average variable cost (AVC),
average total cost (ATC), and marginal cost
X axis = output
Expert Solution
This question has been solved!
Explore an expertly crafted, step-by-step solution for a thorough understanding of key concepts.

Step by step
Solved in 3 steps with 7 images

Knowledge Booster


Learn more about
Need a deep-dive on the concept behind this application? Look no further. Learn more about this topic, economics and related others by exploring similar questions and additional content below.Recommended textbooks for you

Principles of Economics (12th Edition)
Economics
ISBN:
9780134078779
Author:
Karl E. Case, Ray C. Fair, Sharon E. Oster
Publisher:
PEARSON

Engineering Economy (17th Edition)
Economics
ISBN:
9780134870069
Author:
William G. Sullivan, Elin M. Wicks, C. Patrick Koelling
Publisher:
PEARSON
Principles of Economics (12th Edition)
Economics
ISBN:
9780134078779
Author:
Karl E. Case, Ray C. Fair, Sharon E. Oster
Publisher:
PEARSON
Engineering Economy (17th Edition)
Economics
ISBN:
9780134870069
Author:
William G. Sullivan, Elin M. Wicks, C. Patrick Koelling
Publisher:
PEARSON

Principles of Economics (MindTap Course List)
Economics
ISBN:
9781305585126
Author:
N. Gregory Mankiw
Publisher:
Cengage Learning

Managerial Economics: A Problem Solving Approach
Economics
ISBN:
9781337106665
Author:
Luke M. Froeb, Brian T. McCann, Michael R. Ward, Mike Shor
Publisher:
Cengage Learning

Managerial Economics & Business Strategy (Mcgraw-…
Economics
ISBN:
9781259290619
Author:
Michael Baye, Jeff Prince
Publisher:
McGraw-Hill Education