If a p-value reported in the Excel linear regression output associated with a particular variable is 0.007, the confidenc interval for the related regression coefficient includes the zero value at: O a. both the 90% and 95% confidence levels. O b. none of the answers provided O C. the 95% confidence level. Od. the 99% confidence level. Oe. the 90% confidence level.
If a p-value reported in the Excel linear regression output associated with a particular variable is 0.007, the confidenc interval for the related regression coefficient includes the zero value at: O a. both the 90% and 95% confidence levels. O b. none of the answers provided O C. the 95% confidence level. Od. the 99% confidence level. Oe. the 90% confidence level.

Glencoe Algebra 1, Student Edition, 9780079039897, 0079039898, 2018
18th Edition
ISBN:9780079039897
Author:Carter
Publisher:Carter
Chapter4: Equations Of Linear Functions
Section4.6: Regression And Median-fit Lines
Problem 4GP

Related questions
Question
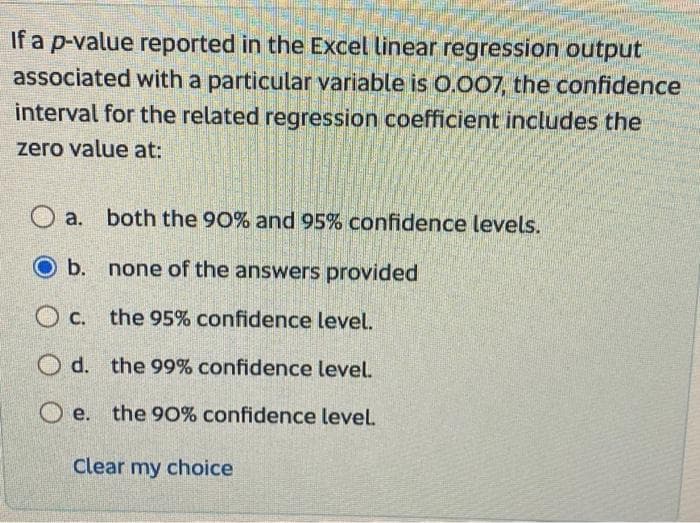
Transcribed Image Text:If a p-value reported in the Excel linear regression output
associated with a particular variable is 0.007, the confidence
interval for the related regression coefficient includes the
zero value at:
Oa. both the 90% and 95% confidence levels.
O b.
none of the answers provided
Oc. the 95% confidence level.
Od. the 99% confidence level.
Oe. the 90% confidence level.
Clear my choice
Expert Solution
This question has been solved!
Explore an expertly crafted, step-by-step solution for a thorough understanding of key concepts.

Step by step
Solved in 2 steps

Recommended textbooks for you
Glencoe Algebra 1, Student Edition, 9780079039897…
Algebra
ISBN:
9780079039897
Author:
Carter
Publisher:
McGraw Hill

College Algebra
Algebra
ISBN:
9781305115545
Author:
James Stewart, Lothar Redlin, Saleem Watson
Publisher:
Cengage Learning

Algebra and Trigonometry (MindTap Course List)
Algebra
ISBN:
9781305071742
Author:
James Stewart, Lothar Redlin, Saleem Watson
Publisher:
Cengage Learning
Glencoe Algebra 1, Student Edition, 9780079039897…
Algebra
ISBN:
9780079039897
Author:
Carter
Publisher:
McGraw Hill
College Algebra
Algebra
ISBN:
9781305115545
Author:
James Stewart, Lothar Redlin, Saleem Watson
Publisher:
Cengage Learning
Algebra and Trigonometry (MindTap Course List)
Algebra
ISBN:
9781305071742
Author:
James Stewart, Lothar Redlin, Saleem Watson
Publisher:
Cengage Learning

Functions and Change: A Modeling Approach to Coll…
Algebra
ISBN:
9781337111348
Author:
Bruce Crauder, Benny Evans, Alan Noell
Publisher:
Cengage Learning