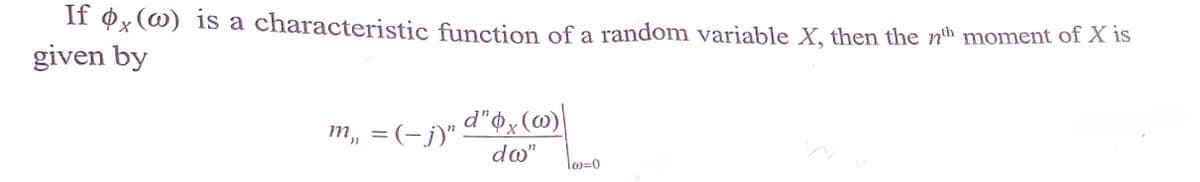
If øx(@) is a characteristic function of a random variable X, then the nh moment of X is given by m, = (-j)" do" lo=0


Q: For the data shown, answer the questions. Round to 2 decimal places. 23.5 7.8 3.1 2.7 29.4 26.8 6.6…
A: For the given data Find Mean =? Median = ? Sample standard deviation = ?
Q: Suppose a random sample of 1040 athletes from the college are asked what their major is. The table…
A: A chi-square test, or specifically Pearson's chi-square test is performed when the test statistic is…
Q: sen the mean number (to the nearest whole number) of stidents who will finish the e less than I bour…
A: here use property of cumulative distribution
Q: used data from the Social Security records to study the average monthly benefit for a specific year…
A: Given, Sample size retired, n1= 63 Sample size disabled, n2=60 Mean benefit retired, x1=$960.50 Mean…
Q: (b)Let Z ~ N(0, 1). Calculate (approximately) the interquartile range of Z. Hint: Þ(Q,) = 0.25 and…
A: Solution
Q: The table below gives the number of seasons that each of the main six colors of Power Range appeared…
A: The bar graph is displayed in the below step.
Q: Fast reactions: In a study of reaction times, the time to respond to a visual stimulus (x) and the…
A: On performing data analysis,
Q: A particular fruit's weights are normally distributed, with a mean of 477 grams and a standard…
A:
Q: Select the most appropriate answer. In 2006, the General Social Survey asked "would you like to see…
A: here use basic of statistics
Q: 4. The scatter plot on the right shows the relationship between two variables, along with the…
A:
Q: What is the degree of freedom between groups? What is the degree of freedom within groups? What is…
A: The provided information is There are 10 families in Makati and 12 families in Quezon. a=10, s=12…
Q: ed in the table. = 0.0804 and the standard deviation of the differences is xdif = fference in the…
A:
Q: Many investors and financial analysts believe the Dow Jones Industrial Average (DJIA) gives a good…
A: Given : x= 33 n =72 p= 0.51
Q: What are the null and alternative hypotheses? b. What is the critical value? (4 decimal points) c.…
A: Given : For male given data : 70,62,72,69,54,73,83,93,72,74
Q: (d) Would it be advisable to use this regression model to predict coffee shop sales for a university…
A: The regression equation is y^=60.00+5.00*x d. The coffee shop sales for a university town with 35000…
Q: What does the intercept mean in this context?
A:
Q: If two random variables X, and X, are independent, then var (X,+X,) = var (X,)+ var (X,) var (X,-…
A:
Q: calculate the mean of X.
A: here use basic of frequency statistic
Q: Test the claim that the proportion of people who own cats is significantly different than 80% at the…
A:
Q: 19. The size of the class interval is
A: here given grouped frequency distribution
Q: The accompanying data are lengths (inches) of bears. Find P20 E Click the icon to view the bear…
A: “Since you have asked multiple questions, we will solve the first question for you. If you want any…
Q: proportion of homes in Oregon that were heated by natural gas is different than what the DOE…
A: Given data number of success , x= 132 sample size, n =331 population proportion,p= 0.48…
Q: Find the characteristic function for a random variable with density functio: fr (x) = x for 0<x<1
A:
Q: What percentage of the sample were female drivers?
A: It is given that Total = 5+7+11+9 = 32 Number of females = 7+9 = 16
Q: 11. The middle number when the number in a set of data is arranged in ascending order 12. The number…
A: We need to answer:- 11. The middle number when the number in a set of data is arranged in ascending…
Q: Select the most appropriate answer. The estimation of the population average age of registered…
A: We need to answer : The estimation of the population average age of registered voters in the state…
Q: Adidas X Parley sports shoes are also sold through the retailers.
A: The given data is supposedly collected using a Questionnaire made using Google forms. The…
Q: El Session Test and Cl for One Proportion Teat of p = 0.5 vs p not = 0.5 Sample 1 X 1 Sample P 95:…
A:
Q: Use the given minimum and maximum data entries, and the number of classes, to find the class width,…
A: Given data minimum=9 maximum=83 classes=6
Q: (5) If X is any random variable, then the inequality, |E[X]<E\X\ exists
A:
Q: QUESTION 14 When they started filming the first season of Mighty Morphin' Power Rangers, the…
A:
Q: In a certain school district, it was observed that 32% of the students in the element schools were…
A: The following information is provided: The sample size is n = 313 sample proportion is P = x/n =…
Q: Them the value of var(X + 2Y) is equal to:
A: First we have to calculate the Var(Y) as Var(Y) = E(Y2) - [E(Y)]2
Q: 3.The process of taking into account a related factor can (pick the best) Select one: a. reverse an…
A: The process of taking into account a related factor can:
Q: 1. use it to calculate a frequency table for variable H. Do the frequencies in the table you…
A: Solution-: We calculate the frequency table for variable H Do the frequencies in the table you…
Q: The graph illustrates a normal distribution for the prices paid for a particular model of HD…
A:
Q: QUESTION 8 A reporter for the local news station in Angel Grove, CA wants to know how widespread…
A: In the given case, option 3 is incorrect because we can safely assume that there is no threat to…
Q: Takeout Food A magazine article reported that 15% of adults buy takeout food every day. A fast-food…
A: Given that Food A magazine article reported that 15% of adults buy takeout food every day. A…
Q: how many people should you sample? 4 80 125 382 383
A: Given : Margin of error: ME = 0.05
Q: Is there sufficient evidence to conclude that the average monthly Social Security benefit is…
A: a) Sample Mean 950.50 Standard Deviation (S1) 98 Sample…
Q: The time it takes me to wash the dishes is uniformly distributed between 11 minutes and 18 minutes.…
A:
Q: 2:35 4 Feels Close to People at their School Feels Sad or or Hopeless Strongly Agree Agreed Unsure…
A: The chi-square contingency table and the software output for the chi-square test of independence is…
Q: You wish to test the following claim (Ha) at a significance level of α=0.01. For the context of this…
A: Hello! As you have posted more than 3 sub parts, we are answering the first 3 sub-parts. In case…
Q: TI R W/ E. 8. 7. 6. 5 4. 3. 2. 24 %23 Jump to Answer Submit Question Question Help: Message…
A: We have given that, The null and alternative hypothesis are : H0 : p = 0.7 versus Ha : p > 0.7…
Q: _9. The mean annual income of workers who are college graduates is greater than Php 100,000 a year.
A: here use basic of hypothesis testing
Q: V Use the given data below to answer item numbers 30 to 39. m Class Interval 50-54 4. 45-49 3 5.7…
A: For the given frequency distributi4on table, we need to answer the following:4 30. The range: 31.…
Q: In the table bellow; suppose we want to calculate the parameters of linear regression m and b 10 11…
A: Given: By using Excel The simple linear regression output of technology Excel Procedure: Using…
Q: For each scenario listed on the left, determine whether the scenario represents an Independent…
A: Matched Pairs and Independent Samples
Q: Find the value of z so that the area under the standard normal curve b. in the right tail 0.9803
A:
Q: More than 35% of people support legalizing gay marriage. Express the null and alternative hy…
A:
Prove the following

Step by step
Solved in 3 steps with 3 images

- Repeat Example 5 when microphone A receives the sound 4 seconds before microphone B.1. Define a random variable X as the proportion of time that a student spends on a certain test. Research suggests that the pdf of x is f(x) = (θ + 1)xθ , 0 ≤ x ≤ 1. For the parameter θ, we know θ > −1, but its exact value is still unknown. To estimate the parameter, a random sample of 10 students is obtained, and their proportions of time are: 0.92, 0.79, 0.90, 0.65, 0.86, 0.47, 0.73, 0.97, 0.94, 0.77. Find the Maximum Likelihood Estimator (MLE) of θ.Suppose X1, X2, ... , Xn is a random sample and Xi = {1, with probability p 0, with probability 1-p} for every i = 1, 2, ... , n. Find the Moment Generating Function of ∑i=1n Xi . What is the distribution of ∑i=1n Xi ?
- Consider a random process which is given by Y(t) = t - Z where Z is a random variable with mean 1.2 and second moment 2.5. The autocovariance of the random process X(t) isA simple random sample X1, …, Xn is drawn from a population, and the quantities ln X1, …, ln Xn are plotted on a normal probability plot. The points approximately follow a straight line. True or false: a) X1, …, Xn come from a population that is approximately lognormal. b) X1, …, Xn come from a population that is approximately normal. c) ln X1, …, ln Xn come from a population that is approximately lognormal. d) ln X1, …, ln Xn come from a population that is approximately normal.A random variable follows a distribution of the form f(x)=k(x+2)e^-x over x>orequalto 0 . Determine the probability that two independent samples are drawn from the population and they both have that 1 < x < 2. State your answer in exact form (with a bunch of e’s), showing all work.
- 13) Random variables X and Y have joint pdf fXY={4xy, 0≤x≤1, 0≤y≤1fXY={4xy, 0≤x≤1, 0≤y≤1 Find Correlation and Covariance2. Y1, Y2, ..., Yn are i.i.d. exponential random variables with E{Yi} = 1/θ. Find thedistribution of Y =1 nPiYi.X is an exponential random variable with λ =1 and Y is a uniform random variable defined on (0, 2). If X and Y are independent, find the PDF of Z = X-Y2
- Show that the random process X(t) =cos(2π fot + θ) Where θ is an random variable uniformly distributed in the range {0, π/2, π, π/3} is a wide sense stationary process .X is an exponential random variable with parameter λ = 4 Calculate P {X ≤ 31 Expectation of a function of random variable: Find E(πcosπx) for X uniformly distributed on [0,1].
