If the 16s RNA gene is present in all bacteria (it is!), why can it be used to distinguish different bacterial species?

Curren'S Math For Meds: Dosages & Sol
11th Edition
ISBN:9781305143531
Author:CURREN
Publisher:CURREN
Chapter10: Reconstitution Of Powdered Drugs
Section: Chapter Questions
Problem 33SST
icon
Related questions
icon
Concept explainers
Question
If the 16s RNA gene is present in all bacteria (it is!), why can it be used to distinguish different bacterial species?
Ruminococcaceae (%)
PC2: 9.32% Variance
0.2
0.0
C
-0.40.4
1.00-
Actinobacteria (%)
0.75-
0.50
0.25
-0.2
0.0
Condition
Hothy
Cromar
1000-
0.2
0.4
PC1: 13.8 % Variance
0.00
Healthy
CF
60-
20-
Healthy
CF
Sutterella (%)
Butyricimonas (%)
20
15.
10-
Alpha Diversity (Chao1)
800-
600
400
Healthy
CF
Таха
Acidaminococcus
Clostridium
Tissierellaceae-
Vellonella-
Clostridiaceae-
Fusobacteriaceae-
Fusobacteria-
Fusobacteriales-
Streptococcaceae-
Lactobacillales-
Bacill
Firmicutes
Actinobacteria-
Ruminococcacene
Caprococcus
Christensenellaceae-
Barnesiellaceae-
Alcaligenaceae-
Verrucomicrobia
Down in CF
Up in CF
Verrucomicrobiales-
Verrucomicrobiaceae-
Verrucomicrobiae-
Sutterella-
Cyanobacteria-
Deltaproteobacteria-
Butyricimonas-
Bilophila
Phylum
Bacter
Promobacteria
Funclectora
Actinctontwr
Desulfovibrionaceae-
Desulfovibrionales-
D
Healthy
CF
1.00-
Healthy
CF
Actinobacteria (%)
0.75
0.50-
0.25
-3
0
في
Cynobacteris
log2(Fold Change)
0.00-
Healthy
CF(Other)
CFTR Genotype
CF(df508)
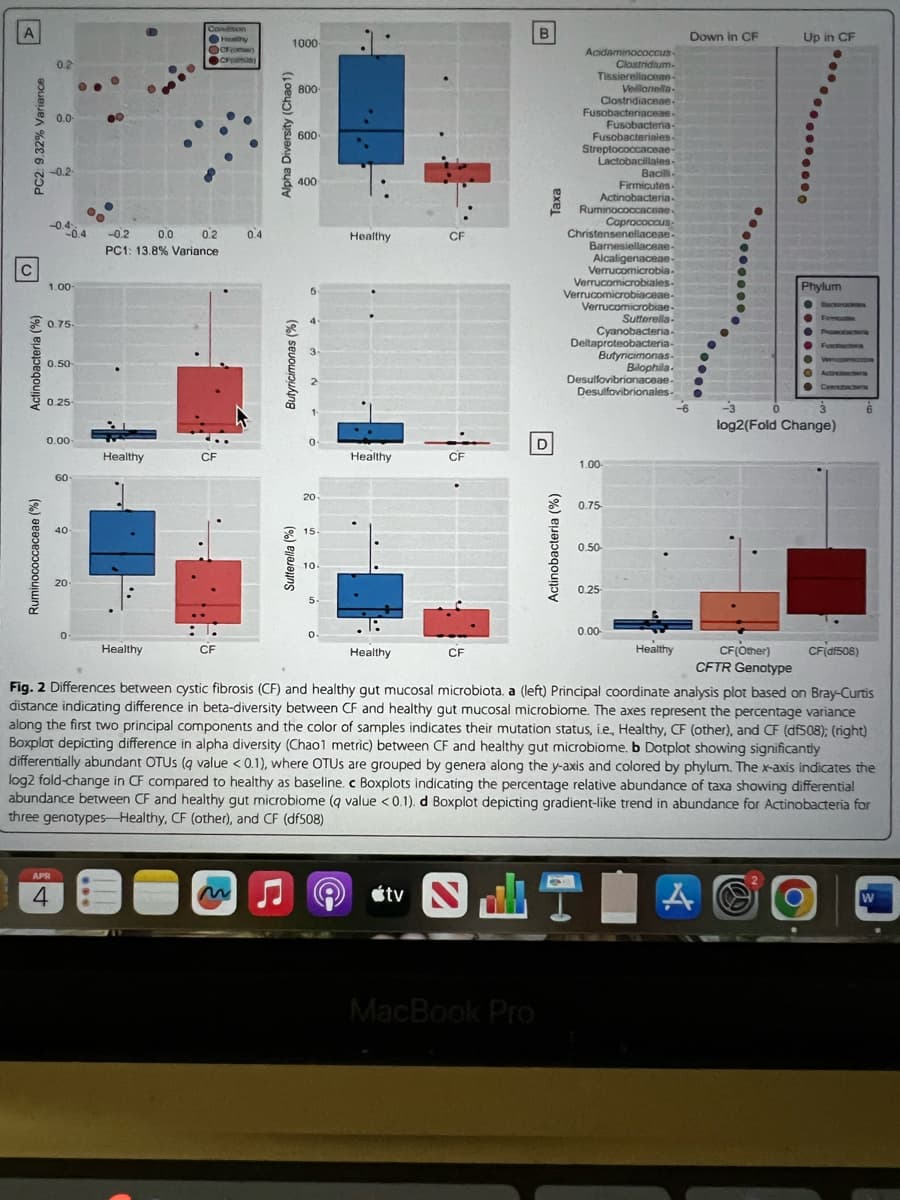
Fig. 2 Differences between cystic fibrosis (CF) and healthy gut mucosal microbiota. a (left) Principal coordinate analysis plot based on Bray-Curtis
distance indicating difference in beta-diversity between CF and healthy gut mucosal microbiome. The axes represent the percentage variance
along the first two principal components and the color of samples indicates their mutation status, ie., Healthy, CF (other), and CF (df508); (right)
Boxplot depicting difference in alpha diversity (Chaol metric) between CF and healthy gut microbiome. b Dotplot showing significantly
differentially abundant OTUS (q value <0.1), where OTUS are grouped by genera along the y-axis and colored by phylum. The x-axis indicates the
log2 fold-change in CF compared to healthy as baseline. c Boxplots indicating the percentage relative abundance of taxa showing differential
abundance between CF and healthy gut microbiome (q value <0.1). d Boxplot depicting gradient-like trend in abundance for Actinobacteria for
three genotypes Healthy, CF (other), and CF (df508)
APR
4
M
tv
ST
A
W
MacBook Pro
Transcribed Image Text:Ruminococcaceae (%) PC2: 9.32% Variance 0.2 0.0 C -0.40.4 1.00- Actinobacteria (%) 0.75- 0.50 0.25 -0.2 0.0 Condition Hothy Cromar 1000- 0.2 0.4 PC1: 13.8 % Variance 0.00 Healthy CF 60- 20- Healthy CF Sutterella (%) Butyricimonas (%) 20 15. 10- Alpha Diversity (Chao1) 800- 600 400 Healthy CF Таха Acidaminococcus Clostridium Tissierellaceae- Vellonella- Clostridiaceae- Fusobacteriaceae- Fusobacteria- Fusobacteriales- Streptococcaceae- Lactobacillales- Bacill Firmicutes Actinobacteria- Ruminococcacene Caprococcus Christensenellaceae- Barnesiellaceae- Alcaligenaceae- Verrucomicrobia Down in CF Up in CF Verrucomicrobiales- Verrucomicrobiaceae- Verrucomicrobiae- Sutterella- Cyanobacteria- Deltaproteobacteria- Butyricimonas- Bilophila Phylum Bacter Promobacteria Funclectora Actinctontwr Desulfovibrionaceae- Desulfovibrionales- D Healthy CF 1.00- Healthy CF Actinobacteria (%) 0.75 0.50- 0.25 -3 0 في Cynobacteris log2(Fold Change) 0.00- Healthy CF(Other) CFTR Genotype CF(df508) Fig. 2 Differences between cystic fibrosis (CF) and healthy gut mucosal microbiota. a (left) Principal coordinate analysis plot based on Bray-Curtis distance indicating difference in beta-diversity between CF and healthy gut mucosal microbiome. The axes represent the percentage variance along the first two principal components and the color of samples indicates their mutation status, ie., Healthy, CF (other), and CF (df508); (right) Boxplot depicting difference in alpha diversity (Chaol metric) between CF and healthy gut microbiome. b Dotplot showing significantly differentially abundant OTUS (q value <0.1), where OTUS are grouped by genera along the y-axis and colored by phylum. The x-axis indicates the log2 fold-change in CF compared to healthy as baseline. c Boxplots indicating the percentage relative abundance of taxa showing differential abundance between CF and healthy gut microbiome (q value <0.1). d Boxplot depicting gradient-like trend in abundance for Actinobacteria for three genotypes Healthy, CF (other), and CF (df508) APR 4 M tv ST A W MacBook Pro
Expert Solution
steps

Step by step

Solved in 3 steps

Blurred answer
Knowledge Booster
Molecular techniques
Learn more about
Need a deep-dive on the concept behind this application? Look no further. Learn more about this topic, biology and related others by exploring similar questions and additional content below.
Similar questions
  • SEE MORE QUESTIONS
Recommended textbooks for you
Curren'S Math For Meds: Dosages & Sol
Nursing
ISBN:
9781305143531
Author:
CURREN
Publisher:
Cengage