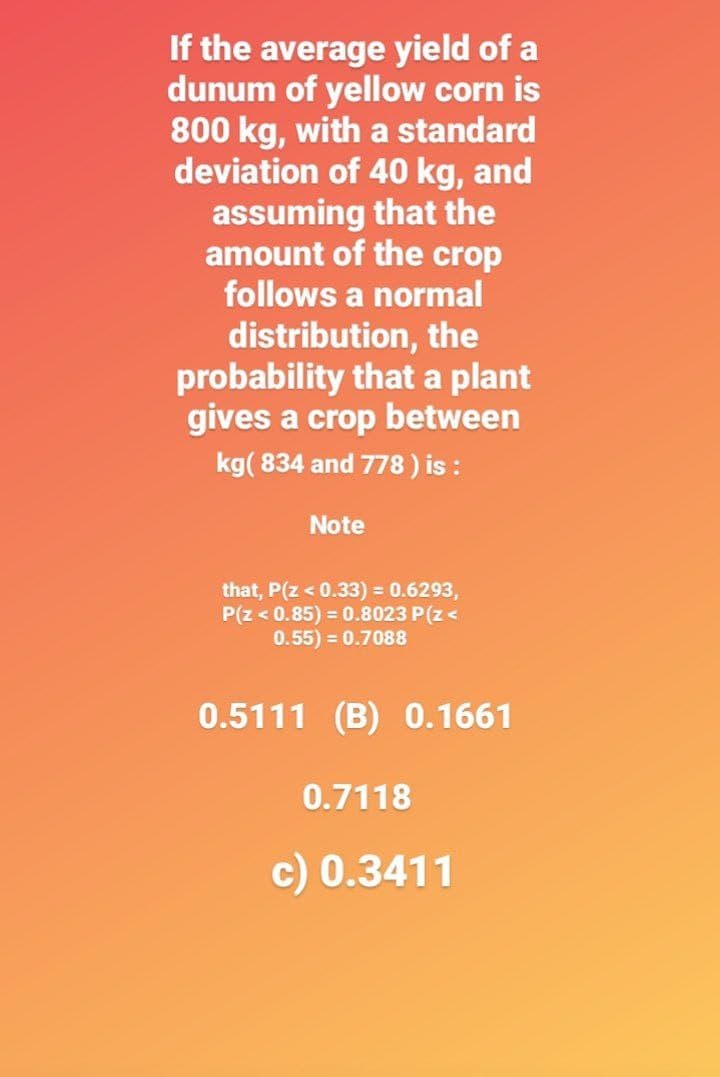
If the average yield of a dunum of yellow corn is 800 kg, with a standard deviation of 40 kg, and assuming that the amount of the crop follows a normal distribution, the probability that a plant gives a crop between kg( 834 and 778) is : Note that, P(Z < 0.33) = 0.6293, P(Z < 0.85) = 0.8023 P(Z < 0.55) = 0.7088
Q: a) Let X₁, X₂ X and Y₁ = (X₁X₂). Y₂=X₂ find g(y₁.yz), gi(yi). b) Let X₁, X₂ - G(a.s) and Y₁ =…
A: Given that a... X1 and X2 chi square with 2 Y1=1/2(X1-X2) Y2=X2 Find g(y1, y2) and g(y1) b.. Let…
Q: Express the confidence interval (68.8 %, 79 %) in the form of p + ME. % ± 96 Question Help: Video…
A: Given CI=(68.8%,79%)
Q: A local government official observed an increase in the number of individuals with cardiovascular…
A: As per the Bartleby guildlines we have to solve first three subparts and rest can be reposted.....…
Q: r the points below find the regression line using least square fit. Please draw the full table as…
A: x y 1 10 2 6 3 9 4 50 5 22 6 20 7 30 8 30 9 35 10 38 55 250
Q: For random sample of 9 pigs, fed diet A and increase in weight in certain period were…
A: Data given for A 10,6,16,17,13,12,8,14,15 Data given for B 7,13,22,15,12,14,18,8
Q: A random sample of 150 adults showed that 66 are already fully vaccinated. a) What is the best point…
A: Given that Sample size n =150 Favorable cases x =66 Sample proportion p^=x/n =66/150 =0.44
Q: A physicist claims that the average wind speed in a certain city is 8 miles per hour. A sample of 33…
A: Given that: Population mean, μ=8 Sample mean, x¯=7.9 Population standard deviation, σ = 0.6 Sample…
Q: What is the most logical order of interpreting statistical results? direction if available, p-value,…
A: First we set the direction like less than or greater than (if available), then calculate pvalue and…
Q: Social media provides an enormous amount of data about the activities and habits of people using…
A: classifying variables into categorical and numerical is integral to statistical analysis.
Q: 9. The table below shows the proportional breakdown of the types of donuts purchased by a customer.…
A: It is given that the proportional breakdown of the types of donuts purchased by a customer. Here,…
Q: Categorical Categorical Categorical Categorical Categorical ProudOrg StayOrg UnManRe CoWrkRe…
A: Given Information: ProudOrg StayOrg UnManRe CowrkRe Schooling Training Aware Engagement Trust 2…
Q: the effectiveness of their newly developed secticide the fecundity of the insect pest A. They check…
A: Given: Replicates A B C D E Control 1 12.8 38.4 35.4 22.4 23.1 22.6 2 21.6 32.9 27.4 27.5…
Q: concentration
A: Given, significance level (α) = 0.01 For Sample 1 : sample size (n1) = 15 sample mean (x̄1) = 7.5…
Q: qualities as options, one of which is "communicator", as the most important quality for an effective…
A: It is given that Favourable cases, X = 121 Sample size, n = 275 Sample proportion, p^ = X/n…
Q: Giving a test to a group of students, the grades and gender are summarized below A B C Total Male 12…
A: Here, x =21 The sample size n = 81. The absolute value of Zα/2 is 2.3263 using the Excel formula…
Q: For the points below find the regression line using least square fit. Please draw the full table as…
A: Given Information: Consider the given data: x y 1 10 2 6 3 9 4 50 5 22 6 20 7 30…
Q: According to a study conducted five years ago by the Organisation for Economic Cooperation and…
A: Given : μ = 4.9 x¯ = 5.06 σ = 0.72 n = 191 α = 0.005
Q: nd Inter-Correlations among Study Variables. D Reliability 1 2 3 8 0.88 (0.852) 0 0.97 0.786 (0.919)…
A: *Answer:
Q: One of the problems encountered by corporations in America is finding an adequate number of…
A:
Q: Given that: Population mean, μ = 8 Sample mean, x = 7.9 Population standard deviation, o=0.6 Sample…
A:
Q: The value of the mean deviation of the following classes التكرارات fi data (fractions are neglected)…
A: Solution-; We have given following table: Class fi 15-25 11 25-35 13 35-45 15 45-55 12…
Q: It is known that the weight loss of those who have completed the program follows a normal…
A: "Since you have posted a question with multiple sub-parts, we will solve the first three sub-parts…
Q: A HUMSS student is conducting a research on the awareness of SHS learners on the names of the…
A: GivenMargin of error(E)=4standard deviation(σ)=7.5confidence level=95%
Q: When the following data is displayed in a frequency table of 6 classes, the class length will be:
A: Here number of classes = 6
Q: It is known that the distribution of individual passengers checked-in baggage weight has a mean of…
A:
Q: Use the graphs in Figure 3 below to answer the questions. Select the letter of the appropriate…
A: Given two frequency histograms.
Q: Most medical schools require applicants for admission to take the Medical College Admissions Test…
A: It is given that mean and standard deviation are 500 and 10.6, respectively.
Q: A random sample of 28 MBAs working in New York revealed that their mean annual salary was $123,000.…
A: Solution-: n=28 ,x¯=123000 ,σ=22000 What is the point estimate (i.e. the "best guess") of the mean…
Q: A civil service exam yields scores which are normally distributed with a mean of 81 and a standard…
A: Solution-: Given: μ=81, σ=5.5 We want to fin x such that, P[X<x]=0.15
Q: 2. Two drug were tested on a group of 2000 people. The following table represents the results of…
A: Introduction In the given scenario, two drugs were tested on a group of 2000 people including males…
Q: For the points below find the regression line using least square fit. Please draw the full table as…
A: Given Information: Consider the given dataset: x y 1 10+6=16 2 6 3 9 4 100-6=94 5 22…
Q: A government official estimates that the mean time required to fill out the long form of the United…
A: Null hypothesis: The average weight has gone down. H0 : μ =36. Alternative hypothesis: H1 :μ ≠ 36
Q: In a test of the effectiveness of garlic for lowering cholesterol, 42 subjects were treated with…
A: Given Mean=3.1 Standard deviations=19.7 n=42
Q: Assume that females have pulse rates that are normally distributed with a mean of μ = 72.0 beats per…
A: The mean is 72 and the standard deviation is 12.5.
Q: The following is based on information take from Winter Wind Studies in Rocky Mountain National Park,…
A: Let d = january - April
Q: Use the given data to find the equation of the regression line. Examine the scatterplot and identify…
A: Given: Sr. No. x y 1 11 7.39 2 9 6.52 3 13 12.69 4 9 7.28 5 10 7.68 6 14 8.88 7 6…
Q: To check homoscedasticity, independence of errors, and linearity, one must graph the relationship…
A: The four assumptions for linear regression are homoscedasticity, linearity, normality, and…
Q: A local department store took a random sample of 64 charge accounts and found that the average…
A:
Q: A doctor wants to estimate the mean HDL cholesterol of all 20- to 29-year-old females. How many…
A: Given : Estimate (E) =4 Standard deviation =15.1
Q: n, how much did this particular home provider earn? Sh
A: here given , In a certain county, the average annual income for a home provider involved with an…
Q: classes repetitions fi 40- 13 52- 30 The mean value of the following data is: 64- 76- 88-100 Σ 36 22…
A: Mean farmula Mean=∑fx/n
Q: Stock Prices A random sample of stock prices per share (in dollars) is shown. Find the 95%…
A: Formula :
Q: 52. Eleven cities are ranked according to their pollution level and occurrence of pulmonary…
A: “Since you have asked multiple questions, we will solve the first question for you. If you want any…
Q: A time study analyst has collected 10 readings on a particular work element of interest and would…
A: formula for the sample size needed to estimate a population mean is
Q: You want to obtain a sample to estimate a population proportion. At this point in time, you have no…
A: Hello. Since your question has multiple, we will solve first question for you. If you want remaining…
Q: Let X₁, X₂,..., X be a r.s. from N(,0) and Y₁, Y₂...., be another independent r.s. from m…
A: Solution
Q: Let X denote the data transfer time (ms) in a grid computing system (the time required for data…
A: Given Mean=37.5 Standard deviations=21.6
Q: 2. Determine each of the following areas and show these graphically. Use probability notation in…
A:
Q: A random sample of 40 drivers in Johor were asked if they favor the use of RON95 or RON97 fuels for…
A:
Q: نه نان فانه | b. D. Calculate the z-statistic for each of the following. Write your answer on the…
A: The objective is to find the z-statistic value for each of the following cases.
Step by step
Solved in 2 steps with 1 images
- An agronomist randomly selected 20 matured calamansi trees of one variety and have a mean height of 10.8ft with standard dev of 1.25ft, while another 12 randomly selected calamansi trees of another variety have a mean height of 9.6ft with standard dev of 1.45ft. Test whether the difference of 2 sample means is significant at α = 5%.An electrical engineer wishes to determine if, among two specific municipal buildings in town, Building “North” and Building “South”, whether the tensile strength of pipes (in psi) is not the same in each of these two buildings. A sample of pipes was chosen at random from both Building “North” and Building “South”, respectively. Using α = 0.05, which of the following statistical test, or parameter, would be best for determining whether tensile strength of pipes (in psi) is not the same in each of these two buildings? (Assume all statistical assumptions met.) a) Binomial Distribution b) Population Difference in Means (i.e., Unpaired Data) c) The Chi-Squared Test of Independence d) Population Mean Difference (i.e., Paired Data)With α = .01, the two-tailed critical region for a t test using a sample of n = 16 subjects would have boundaries of
- Using all 1991 birth records in the computerized national birth certificate registry compiled by the National Center for Health Statistics (NCHS), statisticians Traci Clemons and Marcello Pagano found that the birth weights of babies in the United States are not symmetric ("Are babies normal?" The American Statistician, Nov 1999, 53:4). However, they also found that when infants born outside of the "typical" 37-43 weeks and infants born to mothers with a history of diabetes are excluded, the birth weights of the remaining infants do follow a Normal model with mean μ = 3432 g and standard deviation σ = 482 g. The following questions refer to infants born from 37 to 43 weeks whose mothers did not have a history of diabetes.Using all 1991 birth records in the computerized national birth certificate registry compiled by the National Center for Health Statistics (NCHS), statisticians Traci Clemons and Marcello Pagano found that the birth weights of babies in the United States are not symmetric (\"Are babies normal?\" The American Statistician, Nov 1999, 53:4). However, they also found that when infants born outside of the \"typical\" 37-43 weeks and infants born to mothers with a history of diabetes are excluded, the birth weights of the remaining infants do follow a Normal model with mean μ = 3432 g and standard deviation σ = 482 g. The following questions refer to infants born from 37 to 43 weeks whose mothers did not have a history of diabetes. Compute the z-score of an infant who weighs 3762 g. (Round your answer to at least two decimal places.) Approximately what fraction of infants would you expect to have birth weights between 2890 g and 3410 g? (Express your answer as a decimal, not a percent, and…Using all 1991 birth records in the computerized national birth certificate registry compiled by the National Center for Health Statistics (NCHS), statisticians Traci Clemons and Marcello Pagano found that the birth weights of babies in the United States are not symmetric ("Are babies normal?" The American Statistician, Nov 1999, 53:4). However, they also found that when infants born outside of the "typical" 37-43 weeks and infants born to mothers with a history of diabetes are excluded, the birth weights of the remaining infants do follow a Normal model with mean μ = 3402 g and standard deviation σ = 492 g. Let X be the weight of a randomly selected infant born from 37 to 43 weeks whose mother did not have a history of diabetes. What is the distribution of X? X ~ N (,) Please show the following answers to 4 decimal places. If a healthy infant is randomly chosen, find the probability that the birth weight is below 3156 g. If a healthy infant is randomly chosen, find the…
- Using all 1991 birth records in the computerized national birth certificate registry compiled by the National Center for Health Statistics (NCHS), statisticians Traci Clemons and Marcello Pagano found that the birth weights of babies in the United States are not symmetric ("Are babies normal?" The American Statistician, Nov 1999, 53:4). However, they also found that when infants born outside of the "typical" 37-43 weeks and infants born to mothers with a history of diabetes are excluded, the birth weights of the remaining infants do follow a Normal model with mean μ = 3432 g and standard deviation σ = 482 g. The following questions refer to infants born from 37 to 43 weeks whose mothers did not have a history of diabetes.Compute the z-score of an infant who weighs 2903 g. (Round your answer to two decimal places.)−1.10Correct Approximately what fraction of infants would you expect to have birth weights between 3060 g and 4410 g? (Express your answer as a decimal, not a percent, and…A researcher is concerned that his new antihypertensive medication may be causing insomnia in some of his patients. Suppose he gathers an SRS of 65 patients treated with the study drug with a sample average of 6.6 hours of sleep and a σ=1.1. Assuming that insomnia can be quantified as an average of 4.5 hours of sleep, can we determine with 95% confidence that his drug avoids diagnosis of insomnia as a side-effect?With a = .01, the two-tailed critical region for a t test using a sample of n = 16 subjects would have boundaries of ?
- Use the standard error to construct the approximate prediction interval for Y using an alpha of 5%.In building an arena, steel bars with a mean ultimate tensile strength of 400 Megapascal (MPa) with a variance of 81 MPa were delivered by the manufactured. The project engineer tested 50 steel bars and found out that the mean ultimate tensile strength is 390 MPa. The decision for the extension of the contract with the manufacturer depends on the engineer. Test the hypothesis whether there is no significant difference between the two means using a two-tailed with a=0.01A typical bag of rice weighs 67.5 pounds. A consumer suspects and claims that the mean weight of all bags of rice sold in a local public market is less than the mean weight of all bags of rice sold in a grocery store. To validate this claim, random samples of 12 showed 67.035 pounds (stdev = 1.557 lbs) and 14 bags of rice with mean 66.9607 pounds (stdev = 2.112 lbs) taken from a local market and a grocery store, respectively. Assume that the distributions of both populations are approximately normal, and the population standard deviations are not equal. At alpha = 0.05, is there sufficient evidence to support the consumer’s claim?