Complete the following table with the tax revenue collected and deadweight loss caused by each of the tax proposals. Suppose the government wants to tax the good that will generate more tax revenue at a lower welfare cost. In this case, it should tax (smartphone,leather jacket)because, all else held constant, taxing a good with a relatively (less,more) elastic demand generates larger tax revenue and smaller deadweight loss
Complete the following table with the tax revenue collected and deadweight loss caused by each of the tax proposals. Suppose the government wants to tax the good that will generate more tax revenue at a lower welfare cost. In this case, it should tax (smartphone,leather jacket)because, all else held constant, taxing a good with a relatively (less,more) elastic demand generates larger tax revenue and smaller deadweight loss

Essentials of Economics (MindTap Course List)
8th Edition
ISBN:9781337091992
Author:N. Gregory Mankiw
Publisher:N. Gregory Mankiw
Chapter6: Supply, Demand And Government Policies
Section: Chapter Questions
Problem 7PA

Related questions
Question
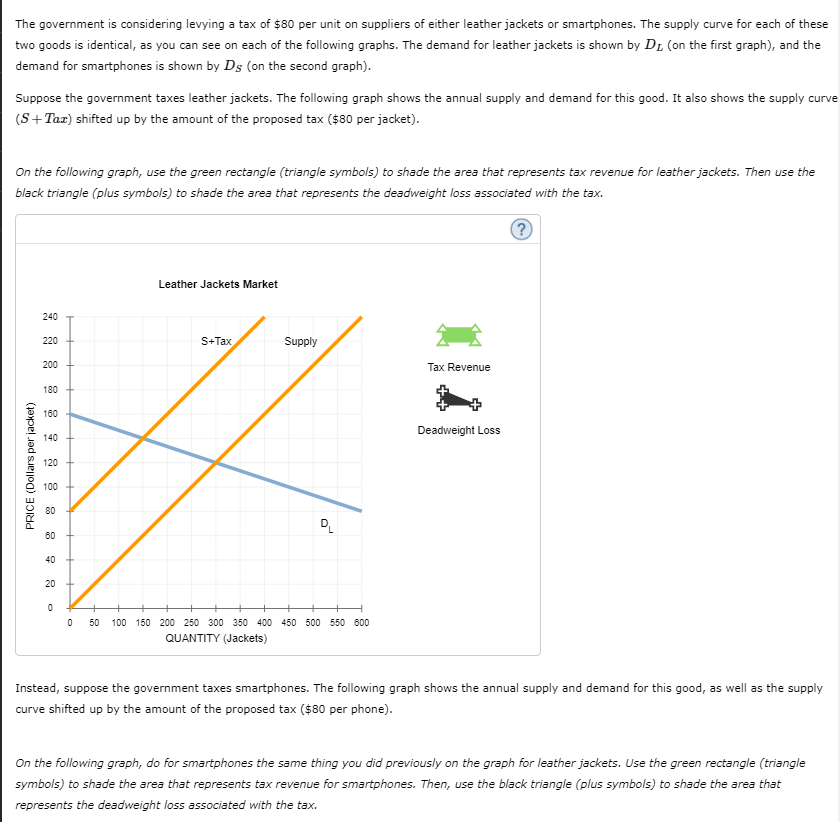
The government is considering levying a tax of $80 per unit on suppliers of either leather jackets or smartphones. The supply curve for each of these two goods is identical, as you can see on each of the following graphs. The demand for leather jackets is shown by DLDL (on the first graph), and the demand for smartphones is shown by DSDS (on the second graph).
Suppose the government taxes leather jackets. The following graph shows the annual supply and demand for this good. It also shows the supply curve (S+TaxS+Tax) shifted up by the amount of the proposed tax ($80 per jacket).
On the following graph, use the green rectangle (triangle symbols) to shade the area that represents tax revenue for leather jackets. Then use the black triangle (plus symbols) to shade the area that represents the deadweight loss associated with the tax.
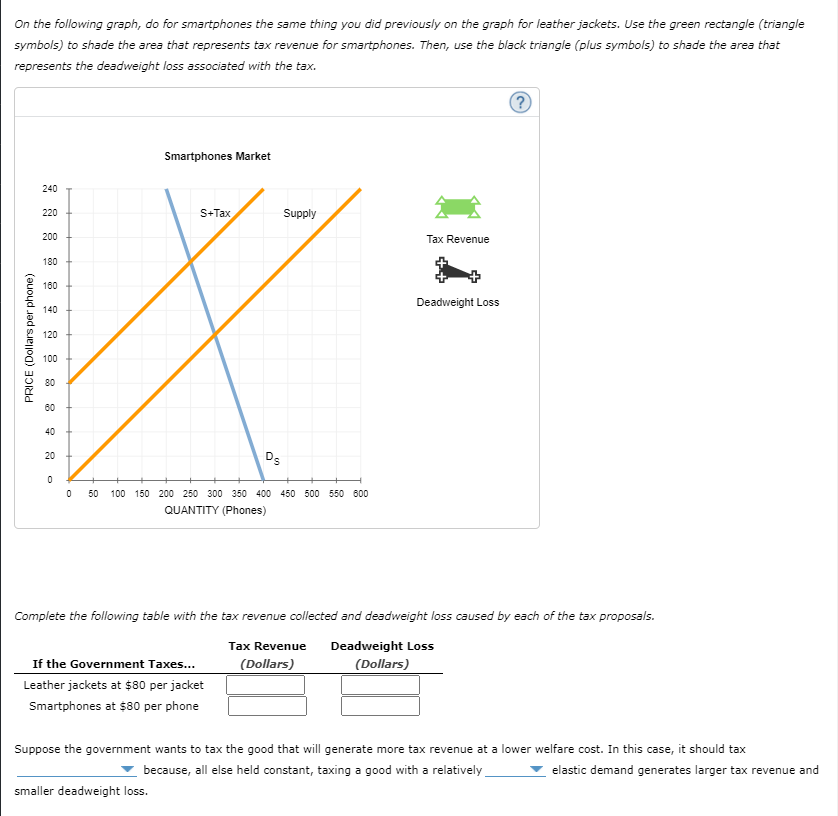
Instead, suppose the government taxes smartphones. The following graph shows the annual supply and demand for this good, as well as the supply curve shifted up by the amount of the proposed tax ($80 per phone).
On the following graph, do for smartphones the same thing you did previously on the graph for leather jackets. Use the green rectangle (triangle symbols) to shade the area that represents tax revenue for smartphones. Then, use the black triangle (plus symbols) to shade the area that represents the deadweight loss associated with the tax.
Complete the following table with the tax revenue collected and deadweight loss caused by each of the tax proposals.
Suppose the government wants to tax the good that will generate more tax revenue at a lower welfare cost. In this case, it should tax (smartphone,leather jacket)because, all else held constant, taxing a good with a relatively (less,more) elastic demand generates larger tax revenue and smaller deadweight loss
Transcribed Image Text:The government is considering levying a tax of $80 per unit on suppliers of either leather jackets or smartphones. The supply curve for each of these
two goods is identical, as you can see on each of the following graphs. The demand for leather jackets is shown by DL (on the first graph), and the
demand for smartphones is shown by Ds (on the second graph).
Suppose the government taxes leather jackets. The following graph shows the annual supply and demand for this good. It also shows the supply curve
(S+Tax) shifted up by the amount of the proposed tax ($80 per jacket).
On the following graph, use the green rectangle (triangle symbols) to shade the area that represents tax revenue for leather jackets. Then use the
black triangle (plus symbols) to shade the area that represents the deadweight loss associated with the tax.
Leather Jackets Market
240
S-Tax
Supply
220
200
Tax Revenue
180
180
Deadweight Loss
140
120
100
80
60
40
20
50
100 150 200 250 300 350 400 450 500 550 600
QUANTITY (Jackets)
Instead, suppose the government taxes smartphones. The following graph shows the annual supply and demand for this good, as well as the supply
curve shifted up by the amount of the proposed tax ($80 per phone).
On the following graph, do for smartphones the same thing you did previously on the graph for leather jackets. Use the green rectangle (triangle
symbols) to shade the area that represents tax revenue for smartphones. Then, use the black triangle (plus symbols) to shade the area that
represents the deadweight loss associated with the tax.
PRICE (Dollars per jacket)
Transcribed Image Text:On the following graph, do for smartphones the same thing you did previously on the graph for leather jackets. Use the green rectangle (triangle
symbols) to shade the area that represents tax revenue for smartphones. Then, use the black triangle (plus symbols) to shade the area that
represents the deadweight loss associated with the tax.
Smartphones Market
240
220
S+Tax
Supply
200
Tax Revenue
180
160
Deadweight Loss
140
120
100
80
60
40
Ds
20
50
100 150 200 250 300 350 400 450 500 550 600
QUANTITY (Phones)
Complete the following table with the tax revenue collected and deadweight loss caused by each of the tax proposals.
Tax Revenue
Deadweight Los
If the Government Taxes..
(Dollars)
(Dollars)
Leather jackets at $80 per jacket
Smartphones at $80 per phone
Suppose the government wants to tax the good that will generate more tax revenue at a lower welfare cost. In this case, it should tax
because, all else held constant, taxing a good with a relatively
elastic demand generates larger tax revenue and
smaller deadweight loss.
PRICE (Dollars per phone)
Expert Solution
This question has been solved!
Explore an expertly crafted, step-by-step solution for a thorough understanding of key concepts.

This is a popular solution!

Trending now
This is a popular solution!

Step by step
Solved in 3 steps with 2 images

Knowledge Booster


Learn more about
Need a deep-dive on the concept behind this application? Look no further. Learn more about this topic, economics and related others by exploring similar questions and additional content below.Recommended textbooks for you
Essentials of Economics (MindTap Course List)
Economics
ISBN:
9781337091992
Author:
N. Gregory Mankiw
Publisher:
Cengage Learning

Principles of Microeconomics
Economics
ISBN:
9781305156050
Author:
N. Gregory Mankiw
Publisher:
Cengage Learning

Exploring Economics
Economics
ISBN:
9781544336329
Author:
Robert L. Sexton
Publisher:
SAGE Publications, Inc
Essentials of Economics (MindTap Course List)
Economics
ISBN:
9781337091992
Author:
N. Gregory Mankiw
Publisher:
Cengage Learning
Principles of Microeconomics
Economics
ISBN:
9781305156050
Author:
N. Gregory Mankiw
Publisher:
Cengage Learning
Exploring Economics
Economics
ISBN:
9781544336329
Author:
Robert L. Sexton
Publisher:
SAGE Publications, Inc

Microeconomics: Private and Public Choice (MindTa…
Economics
ISBN:
9781305506893
Author:
James D. Gwartney, Richard L. Stroup, Russell S. Sobel, David A. Macpherson
Publisher:
Cengage Learning

Macroeconomics: Private and Public Choice (MindTa…
Economics
ISBN:
9781305506756
Author:
James D. Gwartney, Richard L. Stroup, Russell S. Sobel, David A. Macpherson
Publisher:
Cengage Learning

Economics: Private and Public Choice (MindTap Cou…
Economics
ISBN:
9781305506725
Author:
James D. Gwartney, Richard L. Stroup, Russell S. Sobel, David A. Macpherson
Publisher:
Cengage Learning