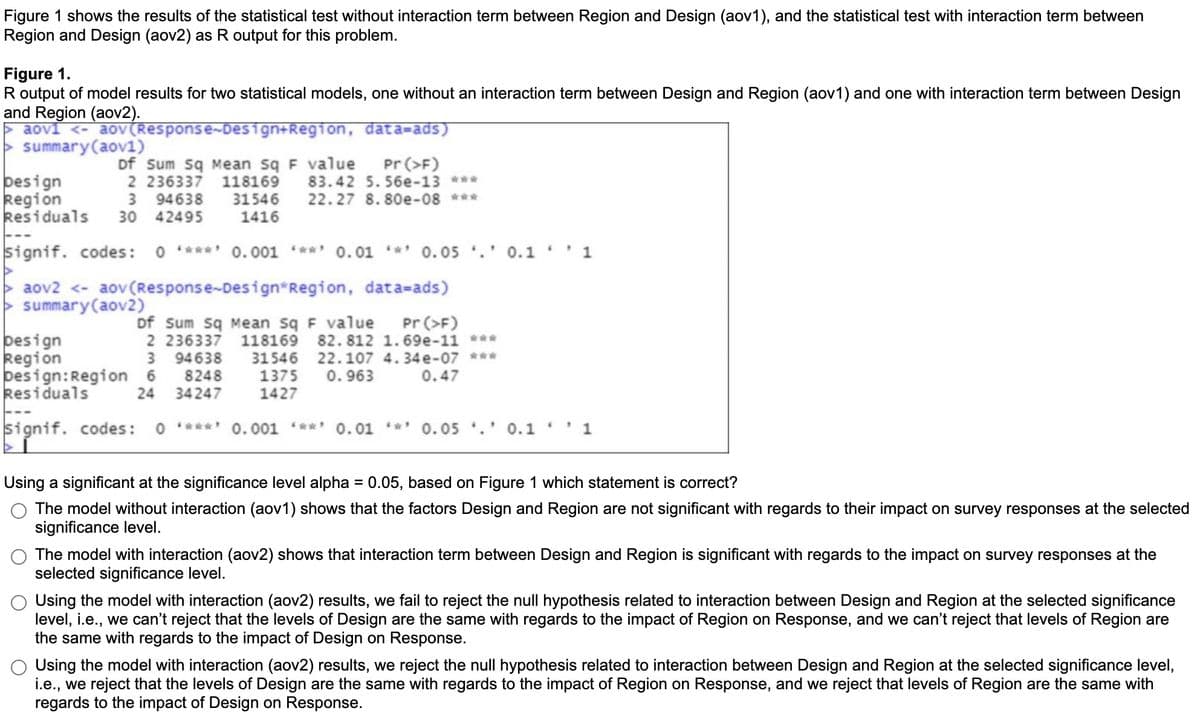
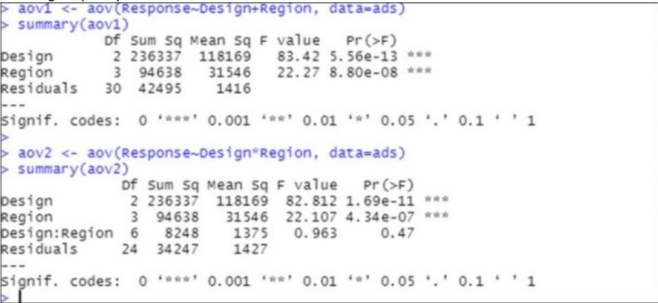
Figure 1 shows the results of the statistical test without interaction term between Region and Design (aov1), and the statistical test with interaction term between Region and Design (aov2) as R output for this problem. Figure 1. R output of model results for two statistical models, one without an interaction term between Design and Region (aov1) and one with interaction term between Design and Region (aov2). > aovi <- aoV(RESPONSE~Design+Region, data=ads) > summary(aov1) pesign Region Residuals --- signif. codes: of Sum sq Mean sq F value 2 236337 118169 3 94638 30 42495 Pr (>F) 83.42 5. 56e-13 *** 22.27 8. 80e-08 *** 31546 1416 O **** 0.001 *** 0.01 * 0.05 0.1 1 aov2 <- aov(Response-Design*Region, data-ads) > summary(aov2) of Sum sq Mean sq F value 2 236337 118169 82. 812 1.69e-11 *** Pr (>F) pesign Region besign:Region 6 Residuals --- signif. codes: 0 **** 0.001 *** 0.01 ** 0.05 .' 0.1 '1 3 94638 8248 24 34247 31546 22.107 4.34 e-07 *** 0. 963 1375 1427 0.47
Figure 1 shows the results of the statistical test without interaction term between Region and Design (aov1), and the statistical test with interaction term between Region and Design (aov2) as R output for this problem. Figure 1. R output of model results for two statistical models, one without an interaction term between Design and Region (aov1) and one with interaction term between Design and Region (aov2). > aovi <- aoV(RESPONSE~Design+Region, data=ads) > summary(aov1) pesign Region Residuals --- signif. codes: of Sum sq Mean sq F value 2 236337 118169 3 94638 30 42495 Pr (>F) 83.42 5. 56e-13 *** 22.27 8. 80e-08 *** 31546 1416 O **** 0.001 *** 0.01 * 0.05 0.1 1 aov2 <- aov(Response-Design*Region, data-ads) > summary(aov2) of Sum sq Mean sq F value 2 236337 118169 82. 812 1.69e-11 *** Pr (>F) pesign Region besign:Region 6 Residuals --- signif. codes: 0 **** 0.001 *** 0.01 ** 0.05 .' 0.1 '1 3 94638 8248 24 34247 31546 22.107 4.34 e-07 *** 0. 963 1375 1427 0.47

MATLAB: An Introduction with Applications
6th Edition
ISBN:9781119256830
Author:Amos Gilat
Publisher:Amos Gilat
Chapter1: Starting With Matlab
Section: Chapter Questions
Problem 1P

Related questions
Question
Transcribed Image Text:Figure 1 shows the results of the statistical test without interaction term between Region and Design (aov1), and the statistical test with interaction term between
Region and Design (aov2) as R output for this problem.
Figure 1.
R output of model results for two statistical models, one without an interaction term between Design and Region (aov1) and one with interaction term between Design
and Region (aov2).
aovi <- aov(Response-Design+Region, data=ads)
summary(aov1)
þesign
Region
Residuals
Df Sum Sq Mean sq F value
2 236337
3 94638
30
118169
31546
1416
Pr (>F)
83.42 5.56e-13 ***
22.27 8. 80e-08 ***
42495
signif. codes: 0 ****' 0.001 ***' 0.01 **' 0.05 '.' 0.1 ''1
aov2 <- aov(Response-Design*Region, data=ads)
summary(aov2)
of Sum sq Mean sq F value
2 236337 118169 82. 812 1.69e-11 ***
Pr (>F)
þesign
Region
þesign:Region 6
Residuals
3 94638
8248
34247
31546 22.107 4. 34e-07 ***
0. 963
1375
1427
0.47
24
---
signif. codes:
O ***
0.001
0. 01 *
0.05 .' 0.1'1
Using a significant at the significance level alpha = 0.05, based on Figure 1 which statement is correct?
%D
The model without interaction (aov1) shows that the factors Design and Region are not significant with regards to their impact on survey responses at the selected
significance level.
The model with interaction (aov2) shows that interaction term between Design and Region is significant with regards to the impact on survey responses at the
selected significance level.
Using the model with interaction (aov2) results, we fail to reject the null hypothesis related to interaction between Design and Region at the selected significance
level, i.e., we can't reject that the levels of Design are the same with regards to the impact of Region on Response, and we can't reject that levels of Region are
the same with regards to the impact of Design on Response.
Using the model with interaction (aov2) results, we reject the null hypothesis related to interaction between Design and Region at the selected significance level,
i.e., we reject that the levels of Design are the same with regards to the impact of Region on Response, and we reject that levels of Region are the same with
regards to the impact of Design on Response.
Expert Solution
Step 1
Given:
The output of R is as follows

Step by step
Solved in 2 steps with 1 images

Recommended textbooks for you
MATLAB: An Introduction with Applications
Statistics
ISBN:
9781119256830
Author:
Amos Gilat
Publisher:
John Wiley & Sons Inc

Probability and Statistics for Engineering and th…
Statistics
ISBN:
9781305251809
Author:
Jay L. Devore
Publisher:
Cengage Learning

Statistics for The Behavioral Sciences (MindTap C…
Statistics
ISBN:
9781305504912
Author:
Frederick J Gravetter, Larry B. Wallnau
Publisher:
Cengage Learning
MATLAB: An Introduction with Applications
Statistics
ISBN:
9781119256830
Author:
Amos Gilat
Publisher:
John Wiley & Sons Inc
Probability and Statistics for Engineering and th…
Statistics
ISBN:
9781305251809
Author:
Jay L. Devore
Publisher:
Cengage Learning
Statistics for The Behavioral Sciences (MindTap C…
Statistics
ISBN:
9781305504912
Author:
Frederick J Gravetter, Larry B. Wallnau
Publisher:
Cengage Learning

Elementary Statistics: Picturing the World (7th E…
Statistics
ISBN:
9780134683416
Author:
Ron Larson, Betsy Farber
Publisher:
PEARSON

The Basic Practice of Statistics
Statistics
ISBN:
9781319042578
Author:
David S. Moore, William I. Notz, Michael A. Fligner
Publisher:
W. H. Freeman

Introduction to the Practice of Statistics
Statistics
ISBN:
9781319013387
Author:
David S. Moore, George P. McCabe, Bruce A. Craig
Publisher:
W. H. Freeman