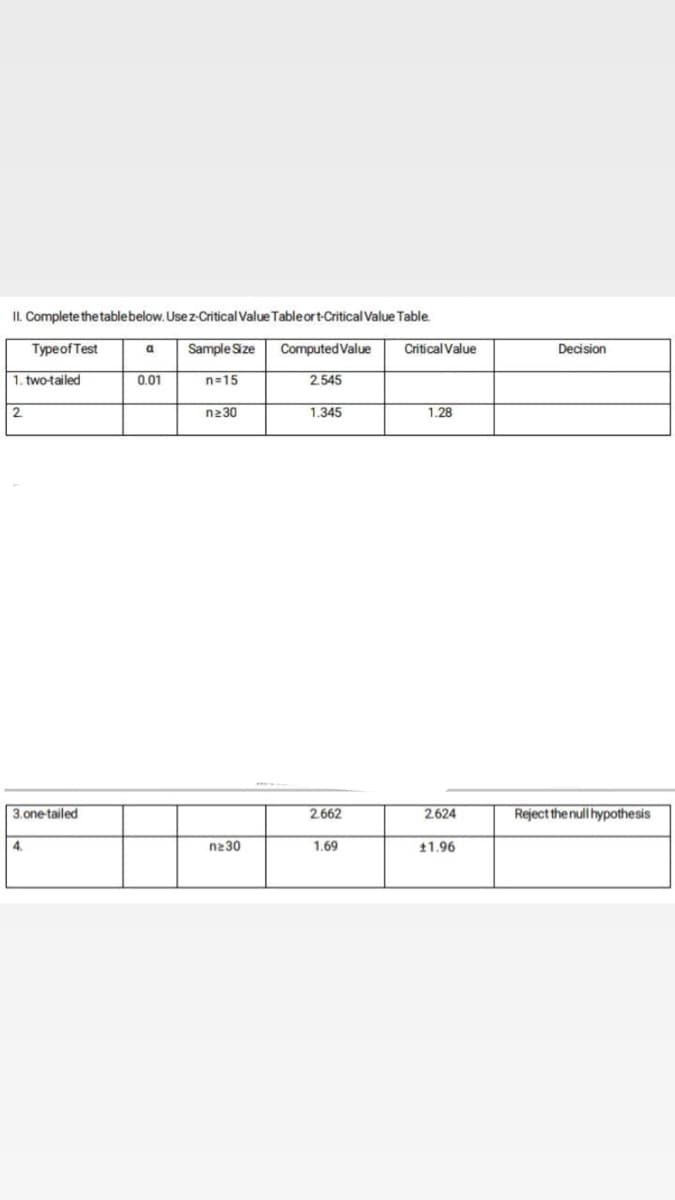
II. Complete the table below. Usez-Critical Value Table ort-Critical Value Table. Type of Test a Sample Size Computed Value 0.01 n=15 2.545 n230 1.345 1. two-tailed 2 Critical Value 1.28 Decision


Q: A new process in manufacturing fertilizers was designed to produce a mean of 880 tons per day. to…
A: Given Information: Hypothesized value of population mean μ=880 Sample size n=50 Sample mean x¯=871…
Q: The phrase "the 97 percent confidence interval for the mean is (70.87, 84.76)" can be translated as…
A: Solution
Q: According to a recent Gallup Poll, 24% of Americans believe that healthcare is the most important…
A: Given P=0.24 n=350
Q: The correct formula for the limit of a confidence interval for μ is: (x-margin of error, x+ margin…
A: In this case, we need to identify the correct option for the given statement.
Q: Suppose Y is normally distributed with mean 5.4 and variance 1.69. Determine the following…
A: Given: Mean μ=5.4 Standard deviation σ=1.69=1.3
Q: A study was conducted to determine the bubble formation of milk as affected by various factors: type…
A: Hello! As you have posted more than 3 sub parts, we are answering the first 3 sub-parts. In case…
Q: (i) What do you mean by Binning ? Explain different method of Binning? (ii) For the Age data given…
A: Central tendency are used to measure the average observation of the data set. Measure of central…
Q: a. A between ANOVA or unrepeated measures were conducted where each subject does only 1 condition of…
A: The objective is to calculate the F-values in the ANOVA table.
Q: Construct a frequency distribution for the given data set using 6 classes. In the table, include the…
A:
Q: a. What is the probability that no questionnaires are filled out and returned? [Select] b. What is…
A: It is given that the x be the number of questionnaires that are filled out and returned. X ~ B( n =…
Q: 1.) Write your solution - A. Determine the 1st quartile, 2d quartile, 3rd quartile and interquartile…
A:
Q: Question 2 Based on the scatterplot below, it appears there is at least one candidate outlier in…
A: Correlation A correlation coefficient is a statistical technique to assess the magnitude of the…
Q: Which of the distributions shown has the smallest standard deviation? e: O The green curve, because…
A: Given : There is given 3 curve in a diagram which is shown by red , green and black color
Q: A sample consists of the following n = 6 scores: -2, 3, -3, 1, -3, 4 Transform the distribution so…
A:
Q: The proportion of individuals that regularly smoke in a population is known to be 0.25. Applying…
A:
Q: solve the following: Flipping a coin 3 times, find the following probability: Exactly 2 heads At…
A:
Q: A media research group uses samples of 5500 households to rank TV shows. The group reported that a…
A:
Q: Math 1350 6.1 Bookwork p. 290, #5 Name 6.5 Consider the population described by the probability…
A:
Q: Treat the number of months X after January 1 that someone is born as uniformly distributed from 0 to…
A: X is uniformly distributed from 0 to 12 40 peoples are surveyed; n=40
Q: The confidence level of an interval estimate is denoted by: * O (1-a)x100% 1+a O (1+a)x100% O a When…
A: The symbol α denotes the level of significance.
Q: 2. Let X be a continuous random variable with density function f(x)= for 0≤x≤2 0, otherwise Find…
A:
Q: During the exam you will be using a sample of 500 adults with the following variables: ● genhelf -…
A: Given that During the exam using a sample of 500 adults with the variables genhelf-variable…
Q: posed of the risk-free rate and stocks A, respect to the three stocks:
A: The portfolio consists of a variety of stocks or a basket of stocks which reduces the overall risk…
Q: Suppose there exists a population where 71% of its members possess a certain characteristic. Let p…
A: Solution-: Given: n=388, P=0.71 (or 71%) We want to find, (a) P(p^<0.77)=? (b)…
Q: A School's working day is divided into six periods. How many different ways may five subjects be…
A: From the provided information, 5 subjects can be arranged in a 6 periods in P56 ways. Any of 5…
Q: In 2016, National Geographic conducted a survey of 1203 college-age American adults who attended a…
A:
Q: 44. Mr. Eduarte wants to construct a sentence featuring the dependent and independent variables.…
A: Dear student according to the guidelines we solve only first question when multiple unrelated…
Q: QPA's are weighted averages where the weights that are used are the number of credits. Find the…
A: Given Credit hours 3 C 4 A- 1 B
Q: I roll a dice (6 side) and then kick a soccer ball toward a goal that many times, each shot has a…
A:
Q: The average daily volume of a computer stock in 2011 was μ = 35.1 million shares, according to a…
A: (b) Obtain the 95% confidence interval about the sample mean of stocks traded in 2018. The 95%…
Q: b) The Mean Deviation (M.D) for the following homogeneous data (16, 15, 17, :12, 18, 10, 9, 35) is…
A:
Q: The table summarizes results from pedestrian deaths that were caused by automobile accidents.…
A: Given Table summarizes results from pedestrian deaths Driver intoxicated Pedestrian intoxicated…
Q: Z: μ = 15.5 X = 14.3 o = 5.5 n = 45 N
A: “Since you have asked multiple questions, we will solve the first question for you. If you want any…
Q: Look at the distributions shown here. Which statement is true? A) The green distribution has a…
A: Two distributions Red and Red, are given.
Q: c) The Coefficient of Variation C.V) for the following data (11, :51, 12, 25, 10, 25, 13) is 70.0349…
A:
Q: show that negative binomial distribution with the following pdf belongs to the exponential family
A:
Q: Suppose that the age of students at George Washington Elementary school is uniformly distributed…
A:
Q: a) The number of red balls in :the box before addition is
A: Total no: of balls=25 let x be the no: of red balls in the box and 25-x be the no: of blue balls…
Q: The nACHR ion channel can be in one of three states: resting (R), closed with Ach bound (C), and…
A: From the given transitions probabilities for the respective states of R, C, and O, it is obtained…
Q: If n = 310 and X = 248, construct a 99% confidence interval for the population proportion, p. Give…
A: According to the given information in this question We need to find the 99% confidence interval
Q: tatistics 1. Use the table below to compute the standard deviation of the following numbers:8, 10,…
A: Given data: 8, 10, 12, 16, 19
Q: The E[MS] for the term associated with Factor A is A. 6+12ΦΑ C. 0² +302AB +120A B. 0²+12 0²A D. 0²…
A: Given:CRD design is given.Number of factors 2 A and B.Factor A with 3 levels.Factor B with 4…
Q: Multiple Choice: Read and answer the following to the correct answer. If your answer is not on the…
A: "Since you have posted a question with multiple sub-parts, we will solve the first three sub-parts…
Q: Q1: a) Consider the following functions of the random variables Y₁, Y2, Y3, and Y4 W₁ = 1 / (Y₁ + Y₂…
A: Hello! As you have posted 2 different questions, we are answering the first question. In case you…
Q: 1 2 3 4 5 6 7 S 9 10 11 12 13 5 7 2 5,1 6,4 3,6,2 4, 5, 1,0 2 7 where 712= 72 students What is the…
A: Here we want to know shape of the distribution.
Q: A sample space (s) in figure below shown that consists of ten outcomes. Event (1) consists of two…
A: here use given venn diagram and Basic probability Rule
Q: Prove using the properties of set operations: a. B-A and An B are disjoint.
A: Solution
Q: 5. When you draw one of the die out of the velvet pouch, what is the probability that you have drawn…
A: here given , there are 2 dice , one is standard and other is weighted Die For standard die…
Q: The foundation of a building is designed to be supported by 100 piles with a capacity of 80 tons…
A: Since you have posted a question with multiple subparts, we will solve first 3 sub-parts for you…
Q: The average cost to rent a single-family home in Sebastian is $1,887 per month. Assume that the…
A: From the information we find the probability.

Step by step
Solved in 2 steps

- Determine which of the following statements are true about the critical region. The critical region is a term used when the null hypothesis is rejected. The critical region is comprised of extreme sample values that are very unlikely to be obtained if the alternative hypothesis is true. The critical regions is determined by the alpha level. The critical region is comprised of extreme samples values that are very unlikely to be obtained if the null hypothesis is true1. What does it imply if if more values are concentrated above the mean? (Skewness) And would the value of skewness be less than, greater than, or equal to 0? 2. In case the data is highly skewed, can we still rely on the kurtosis coefficient? Why or why not? 3. Can the z-score be a real measure of dispersion?Arandom sample of 450 observations produced a sample proportion equal to 0.38. Find the critical and observed values of z for the following test of hypotheses using alpha = 0.025 . H 0 :p=0.30 versus H 1 :p not equal to 0.30
- An education researcher claims that 57% of college students work year-round. In a random sample of 500 college students, 285 say they work year-round. At α=0.05, is there enough evidence to reject the researcher's claim? Complete parts (a) through (e) below. (a) Identify the claim and state H0 and Ha. (b) Find the critical value(s) and identify the rejection region(s) (c) Find the standardized test statistic z . (d) Decide whether to reject or fail to reject the null hypothesis and interpret the decision in the context of the original claim.A researcher who wants to know whether the proportion of male births in a hospital is different from the established baseline of 51.07%, would like to test the following hypotheses: Ho:P = 0.51 vs. Ha :P = does not equal 0.51 a) Is the alternative hypothesis upper tail, lower tail, or two tailed? b) What do you conclude if the test results p-value of 0.03 at alpha value = 5% c) What do you conclude if the test results p-value of 0.08 at alpha value = 10%Suppose a company claims that its market share is less than 16 percent, on average. Several of coworkers do not believe this, so a director decides to do a hypothesis test, at a 1% significance level, to persuade them. He conducts 21 surveys, collects the proper data, and works through the testing procedure: H0: μ≥16; Ha: μ<16 x¯=15.8 σ=1.8 α=0.01 (significance level) The test statistic is z0=x¯−μ0σn√=15.8−161.821√=−0.51 The critical value is −z0.01=−2.33. Conclude whether to reject or not reject H0, and interpret the results. Select the correct answer below: Reject H0. At the 1% significance level, the test results are not statistically significant and at best, provide weak evidence against the null hypothesis. Reject H0. At the 1% significance level, the data provide sufficient evidence to conclude that the mean market share is less than 16 percent. Do not reject H0. At the 1% significance level, the test results are not statistically significant…
- An education researcher claims that at most 3% of working college students are employed as teachers or teaching assistants. In a random sample of 600 working college students, 4% are employed as teachers or teaching assistants. At α=0.01, is there enough evidence to reject the researcher's claim? Complete parts (a) through (e) below. A. Identify the claim and state HO and Ha B. Find the Critical Value(s) and identify the rejection region(s) C. Find the standardized test statistic d. Decide whether to reject or fail to reject the null hypothesis and interpret the decision in the context of the original claim.#1 The Pastry shop claims that its chocolate cookies have exactly 60% chocolate per cookie. A chemist invents an additive to increase the life of an automobile battery. He claims that now the lifetime of the automobile battery with the additive is more than 24 months. The 50Cents Store claims that their daily profit is at most $1000. For each of the following claims: Mention what kind of test should be used (one-tail, two-tail) and set up the null and alternate hypothesis. Consider that the critical value is = CV (cv represents a number already retrieved from table, for example 1.96). For each H0, mentioned the acceptance range.A researcher is using a two-tailed hypothesis test with α = .05 to evaluate the effect of a treatment. If the boundaries for the critical region are t = ± 2.080, then how many individuals are in the sample? Group of answer choices
- Suppose a mechanic claims that a machine filling bottles with saline solution is not equal to 153 ml, on average. Several of his coworkers do not believe him, so the mechanic decides to do a hypothesis test, at a 1% significance level, to persuade them. He fills 18 bottles, collects the proper data, and works through the testing procedure: H0: μ=153; Ha: μ≠153 x¯=156 σ=13 α=0.01 (significance level) The test statistic is: z0=x¯−μ0σn√=156−1531318√=0.98 The critical values are −z0.005=−2.58 and z0.005=2.58 Conclude whether to reject or not reject H0, and interpret the results. -Reject H0. At the 1% significance level, the test results are not statistically significant and at best, provide weak evidence against the null hypothesis. -Reject H0. At the 1% significance level, the data provide sufficient evidence to conclude that the mean filled bottle of saline solution is not equal to 153 ml. -Do not reject H0. At the 1% significance level, the test results are not statistically…Q1/ Consider the following hypothesis test : H0:μ 65 Ha:μ 65 A sample of size 15 provided a sample mean (63) and population standard deviation is (2). a-Compute the test statistic. b-Compute p-value from the table? What is the rejection rule ? and what is your conclusion at α=0.05? c-What is the rejection rule ,using critical vale approach? What is your conclusion at α=0.05? .............................................................................................................................. Q2/ Consider the following hypothesis test : H0:μ =12.5 Ha:μ ‡12.5 A sample of size 18 provided a sample mean (12.9) and sample standard deviation is (0.8). a-Compute the test statistic. b-Determine the range of p-value from the table of t-distribution? What is the rejection rule ?Q1/Consider the following hypothesis test : H0:μ 65 Ha:μ 65 A sample of size 15 provided a sample mean (63) and population standard deviation is (2). a-Compute the test statistic. b-Compute p-value from the table? What is the rejection rule ? and what is your conclusion at α=0.05? c-What is the rejection rule ,using critical vale approach? What is your conclusion at α=0.05? ........................................................................................................................ Q2 /Consider the following hypothesis test : H0:μ =12.5 Ha:μ ‡12.5 A sample of size 18 provided a sample mean (12.9) and sample standard deviation is (0.8). a-Compute the test statistic. b-Determine the range of p-value from the table of t-distribution? What is the rejection rule ?


