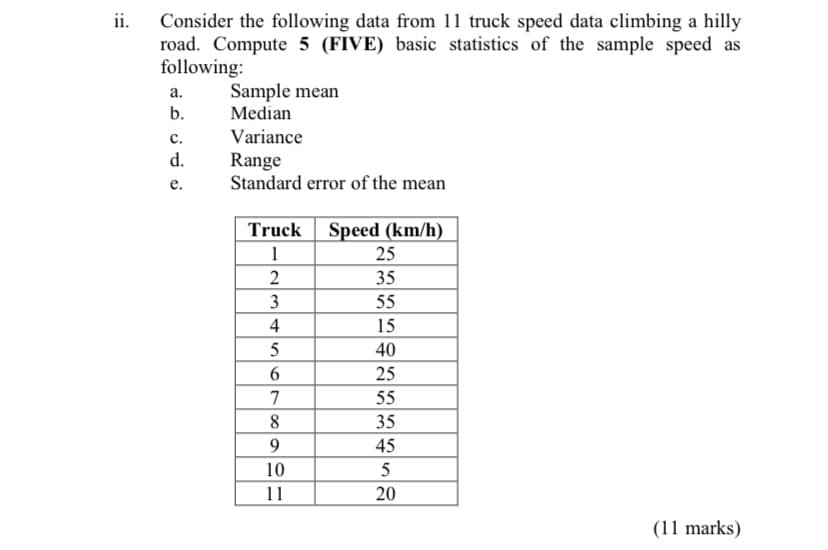
ii. Consider the following data from 11 truck speed data climbing a hilly road. Compute 5 (FIVE) basic statistics of the sample speed as following: Sample mean Median а. b. с. Variance d. Range Standard error of the mean е. Truck Speed (km/h) 1 25 2 35 55 4 15 40 25 55 8. 35 9 45 10 11 20 (11 marks)
Q: Consider the following data set: 49.95 50.05| 49.81 | 50.17| 50.27 49.96 50.01 || 49.84 | 50.02 |…
A: Given: Sample size n = 30 Formula Used: Sample Mean = 1n∑Xi Sample median (When n is even) =…
Q: Ministry of Health is interested in determining whether the average nicotine content of regular,…
A: Data for Nicotine content is given for 16 different brands Cigrate types 3(regular, menthol,…
Q: Consider the following types of data that were obtained from a random sample of 49 credit card…
A: (a) An outstanding balance on a credit card account is simply the total amount you owe at a given…
Q: Find the mean, mode, median, range, standard deviation, variance, skewness, and kurtosis of CGPA…
A: Given - The above 25 samples are given below n= 25 ∑x= 69.69 To Find - a) Mean ,Mode ,…
Q: The Ministry of Health is interested in determining whether the average nicotine content of regular,…
A: For the given data Perform Anova: Single Factor
Q: The following data represent the flight time(in minutes) of a random sample of seven flights from…
A: Range of a data set is the difference between the minimum and maximum observations.
Q: The Ministry of Health is interested in determining whether the average nicotine content of regular,…
A: Suppose if there are k groups. We want to test the mean between these groups are same. The null…
Q: Consider the following frequency dlstribution for a sample of 20 observations Class 0 < 5 5< 10 10 <…
A: Given Data: Class Midpoint (x) Frequency (f) x f 0-5 2.5 5 12.5 5-10 7.5 6 45 10-15 12.5 9…
Q: From the following data, calculate the z-score. N = 100…
A: It is given that the sample mean, x-bar is 15, sample size, n is 100, population mean (mu) is 22,…
Q: The Ministry of Health is interested in determining whether the average nicotine content of regular,…
A: For the given data perform Anova single factor
Q: The Ministry of Health is interested in determining whether the average nicotine content of regular,…
A: Note: Hey, since there are multiple subparts posted, as per guidelines we will answer first three…
Q: 1. Use your calculator to plot a scatterplot of the following sample data. (You don't have to graph)…
A: Hey there.! thank you for posting your question. Hope you’re doing well. Since you have posted…
Q: The following sample data reflect electricity bills (in Omani Riyals) for ten households in Sur, in…
A: Given data: 70, 210, 100, 160, 170, 300, 170, 240, 180, 210 Calculation of Mean: Mean is the sum of…
Q: I need assistance with this question number 3. IN the picture attached I provided my results for…
A: 3.It is known that arithmetic mean is dependent of both origin and scale. That is,
Q: The hillcrest golf and country club manager selected a random of the members and recorded the number…
A: Note : Since we only answer up to 3 sub-parts, we’ll answer the first 3. Please resubmit the…
Q: Which of the following values will give us the most relevant information about a particular group of…
A: Hint: Different data sets may have the same mean. So, the Mean is not enough to get the relevant…
Q: Consider the following frequency distribution for a sample of 20 observations Class 0 < 5 5 < 10 10…
A: Given Data: Class Midpoint (x) Frequency (f) (x-mean)2 f (x-mean)2 0-5 2.5 5 36 180 5-10 7.5…
Q: A. Consider the following sample with 20 observations: 1 1 5 7 9 11 20 21 23 28 28 31 11 39 (i)…
A: I solved exactly first three subparts because of bartleby policy if you want more please upload…
Q: The Ministry of Health is interested in determining whether the average nicotine content of regular,…
A: Given that The excel output of the problem is Given below Hence no alpha is Given taken alpha as…
Q: The following data give the numbers of pieces of junk mail received by 10 office secretaries during…
A: Given: data n =10 To find : i) range ii) variance iii) standard deviation
Q: 4. Compute coefficient of quartile deviation from the following data : Marks 10 20 30 40 No. of…
A:
Q: The following are the scores in Math of the sampled 15 Grade 10 students. 60 61 58 70 62 78 80 68 85…
A:
Q: Consider the following frequency distribution for a sample of 20 observations Class 0 <5 5< 10 10 <…
A: The table helps to find the sample variance. Interval Frequency Mid-point ∑f(x-x-bar)^2 0<5…
Q: The Ministry of Health is interested in determining whether the average nicotine content of regular,…
A: Null Hypothesis: H0: The means for the three cigarettes are equal. Alternative Hypothesis: H1: The…
Q: 24. If an analysis of variance is used for the following data, what would be the effect of changing…
A: 24. The formula for sum of squares within(Error) is SSwithin=∑SSi. When the value of SS2 changing…
Q: A random sample of response times in minutes of the Farmington Volunteer Ambulance Corps was reco 14…
A: Given data, 14,20,29,24,25,10,14,28,12,18,16,12,14,26,24,13,20,24,25,18 Sort the data in ascending…
Q: A researcher is interested in studying the connection between the time spent using electronics and…
A: b.) a group of 500 respondents from the ages of 13-19 who live in the state of New York
Q: 3. Find out the value of quartile deviation and its coefficient from the following data Roll No. 3…
A:
Q: Given the following information, calculate the pooled sample variance that should be used in the…
A:
Q: Which of the following values will give us the most relevant information about a particular group of…
A: Sol:- Correct option :-
Q: Consider the following frequency distribution. Class Midpoint Frequency 0 – 9 4.5 6 10 – 19 14.5 14…
A:
Q: ferent brands differ. The data from the sample is provided below. Regular 1.1 1.7 1.1 1.4…
A: By applying ANOVA test for a single factor,
Q: The math grades of the 40 students in a class are given by the table 1 2 3 4 5 6 7 8 9 X₁ F₁ 1 3 5 6…
A:
Q: The Ministry of Health is interested in determining whether the average nicotine content of regular,…
A: Given: required part (e) Regular Menthol Filtered 1.1 1.1 0.4 1.7 0.8 1 1.1 1 1.2 1.4…
Q: Complete the following problems (from your textbook) for Week 2: 3.10 The file MobileLoyalty…
A: (a) Use PH Stat to obtain the values of mean and median. PH Stat Procedure: Step 1: In EXCEL,…
Q: 2. Compute and interpret the sample correlation for the following dataset. Yi 4 50 11 40 3 60 16 30
A: The given data are xi yi xi*yi xi2 yi2 4 50 200 16 2500 11 40 440 121 1600 3 60 180 9 3600…
Q: A researcher has obtained the following number of hours worked per week during the summer for a…
A: Solution: Note: Hello! As you have posted more than 3 sub parts, we are answering the first 3…
Q: Consider the following frequency distribution for a sample of 20 observations Class 0<5 5 < 10 10 <…
A: Variance= E(X2)- (E(X))2 Where E(X)= summation (f*X)/(summation f) E(X2)= (Summation…
Q: Which of the following sets of data is most likely to produce a significant t statistic? Select…
A:
Q: Table Physical Health Complaints and Burnout among Social Workers: One-Way Analysis of Variance…
A:
Q: 2) in a spot speed study for a highway section, the data were collected and shown in the table…
A: As per guidelines we will only answer first three subparts, please repost other subparts for more…
Q: Given the following dataset of the price of a gallon of gas: $2.85; $3.06; and $2.99. Calculate the…
A:
Q: Calculate pooled variance from the following raw data: Group 2 4 Group 1 16 11 10 9 15 7 13 12 4 9.…
A: The mean of group 1and group 2 are,
Q: Hakims shoes reported the following sales results Size 4 5 6…
A: Given data size 4 5 6 7 8 9 10 frequency 5 11 15…
Q: Once again, consider the data for Fred's caloric intake. 2000 2200 2100 2400 2500 1900…
A:
Q: Consider the following data set: | 49.95 | 50.05 | 49.81 | 50.17 | 50.27 | 49.96 | 50.01 | 49.84 |…
A: Here given is a data set. We will use Excel to solve the problem. Enter the data into the…
Q: Which of the following histogram correctly shows the sampling distribution of sample means of size…
A: The population is the set of all the possible elements or observations. The sample is the subset of…
Q: Consider the data with analysis shown in the following computer output: Level N Mean StDev A 6…
A: Pooled standard deviation: Pooled standard deviation is simply the square root of Mean square error…
Q: Consider the following frequency distribution for a sample of 20 observations Class 0<5 5 < 10 10 <…
A:
Q: 4. Calculate the range and the sample standard deviation for the following data. High High High City…
A: Solution: 4. Let X be the random variable. The given data is 55, 60, 65, 65, 70, 70, 75, 80 and 81.…
Step by step
Solved in 2 steps with 1 images