III. Consider the correlation data given the provided data and graph: a) How are IQ and reading achievement related? IV. Evaluate the data from a psychological testing perspective: a) Are these samples good representations of the general population? How do you know? b) What could you do to make them a more representative sample? CHOW would you interpret the correlation results? d) What are some ways this knowledge of their relationship could be used?
III. Consider the correlation data given the provided data and graph: a) How are IQ and reading achievement related? IV. Evaluate the data from a psychological testing perspective: a) Are these samples good representations of the general population? How do you know? b) What could you do to make them a more representative sample? CHOW would you interpret the correlation results? d) What are some ways this knowledge of their relationship could be used?

Chapter9: Sequences, Probability And Counting Theory
Section9.7: Probability
Problem 2SE: What is a sample space?

Related questions
Question
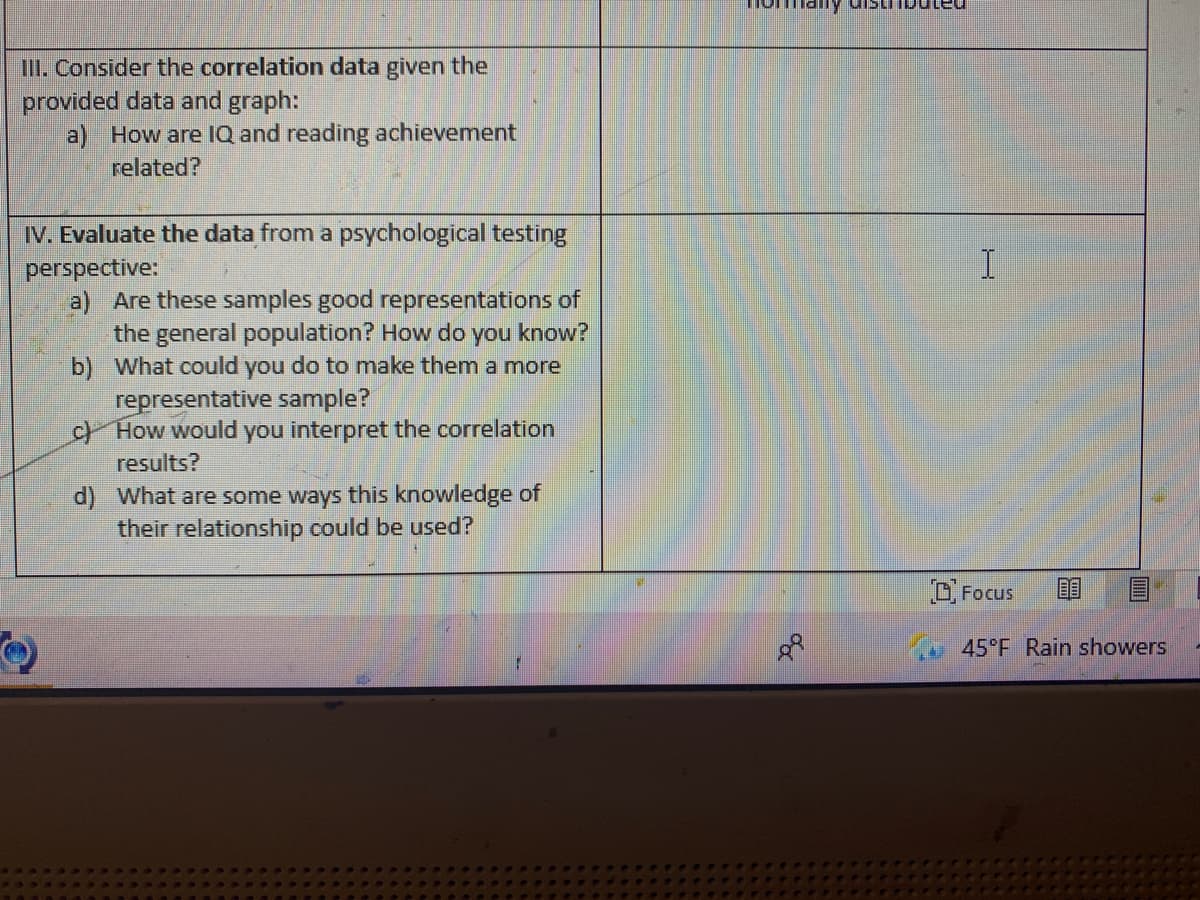
Transcribed Image Text:II. Consider the correlation data given the
provided data and graph:
a) How are IQ and reading achievement
related?
IV. Evaluate the data from a psychological testing
perspective:
a) Are these samples good representations of
the general population? How do
b) What could you do to make them a more
you
know?
representative sample?
c How would you interpret the correlation
resu
d) What are some ways this knowledge of
their relationship could be used?
Focus
45°F Rain showers
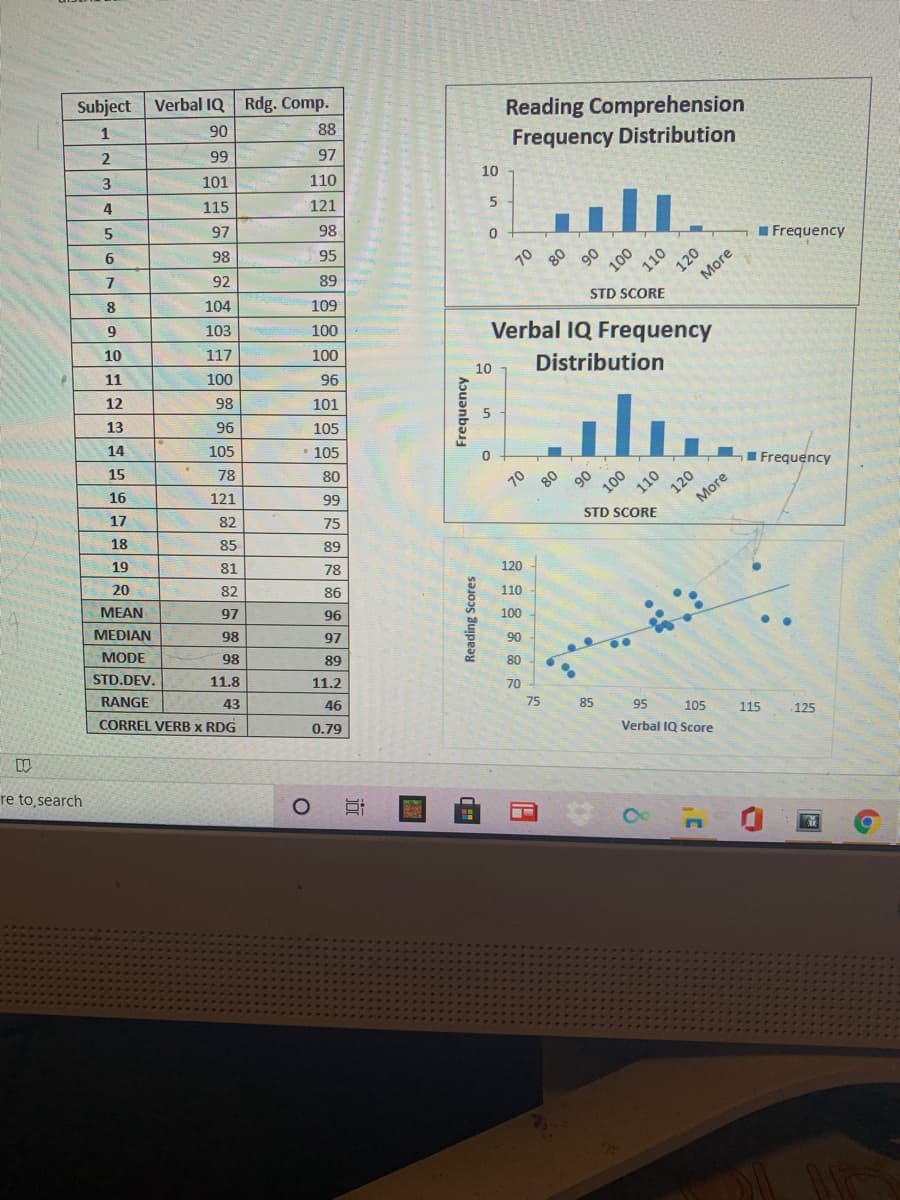
Transcribed Image Text:Subject
Verbal IQ Rdg. Comp.
Reading Comprehension
Frequency Distribution
1
90
88
99
97
3
101
110
10
4
115
121
5
97
98
I Frequency
98
95
10 80
90
100
120
More
92
89
8
104
109
STD SCORE
9
103
Verbal IQ Frequency
100
10
117
100
Distribution
11
100
96
10
12
98
101
13
96
105
14
105
• 105
15
78
80
IFrequency
16
121
110
99
More
17
82
75
STD SCORE
18
85
89
19
81
78
120
20
82
86
110
МEAN
97
96
100
MEDIAN
98
97
90
MODE
98
89
80
STD.DEV.
11.8
11.2
70
RANGE
43
46
75
85
CORREL VERB x RDG
95
105
115
125
0.79
Verbal IQ Score
re to,search
Frequency
近
110
Reading Scores
120
Expert Solution
This question has been solved!
Explore an expertly crafted, step-by-step solution for a thorough understanding of key concepts.

This is a popular solution!

Trending now
This is a popular solution!

Step by step
Solved in 2 steps

Recommended textbooks for you