Ilustration 17.11. You are given below a frequency distribution. Fit a normal curve to the data. Mid value 412 417 422 427 432 437 442 447 452 457 Frequency 6. 34 132 179 218 183 146 69 30
Ilustration 17.11. You are given below a frequency distribution. Fit a normal curve to the data. Mid value 412 417 422 427 432 437 442 447 452 457 Frequency 6. 34 132 179 218 183 146 69 30

Holt Mcdougal Larson Pre-algebra: Student Edition 2012
1st Edition
ISBN:9780547587776
Author:HOLT MCDOUGAL
Publisher:HOLT MCDOUGAL
Chapter11: Data Analysis And Probability
Section11.1: Stem-and-leaf Plots And Histograms
Problem 10E

Related questions
Question
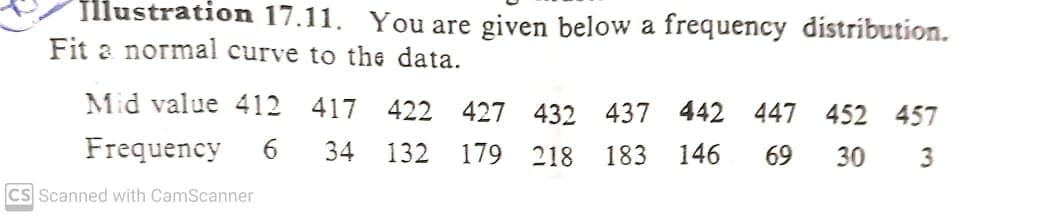
Transcribed Image Text:Illustration 17.11. You are given below a frequency distribution.
Fit a normal curve to the data.
Mid value 412 417
422
427 432 437 442
447 452 457
Frequency
6.
34
132 179 218
183
146
69
30
CS Scanned with CamScanner
Expert Solution
This question has been solved!
Explore an expertly crafted, step-by-step solution for a thorough understanding of key concepts.

Step by step
Solved in 3 steps with 3 images

Recommended textbooks for you
Holt Mcdougal Larson Pre-algebra: Student Edition…
Algebra
ISBN:
9780547587776
Author:
HOLT MCDOUGAL
Publisher:
HOLT MCDOUGAL

College Algebra (MindTap Course List)
Algebra
ISBN:
9781305652231
Author:
R. David Gustafson, Jeff Hughes
Publisher:
Cengage Learning

Glencoe Algebra 1, Student Edition, 9780079039897…
Algebra
ISBN:
9780079039897
Author:
Carter
Publisher:
McGraw Hill
Holt Mcdougal Larson Pre-algebra: Student Edition…
Algebra
ISBN:
9780547587776
Author:
HOLT MCDOUGAL
Publisher:
HOLT MCDOUGAL
College Algebra (MindTap Course List)
Algebra
ISBN:
9781305652231
Author:
R. David Gustafson, Jeff Hughes
Publisher:
Cengage Learning
Glencoe Algebra 1, Student Edition, 9780079039897…
Algebra
ISBN:
9780079039897
Author:
Carter
Publisher:
McGraw Hill