image below. The student could not explain why he did not see about 90 of the confidence intervals capturing the population proportion of 0.24. Please select the answer choice that provides the best explanation to this student. Confidence intervals for P. p=0.24, Type Standard-Wald Astatistics student ran StatCrunch's confidence interval applet for a proportion with a population proportion of 0.24, à 90% Confiderce levei, Sample sire=12 CI Level Containing p Total Proportion 0.9 100 0.77 77 Jatera I to O a. It is impossible to use a population proportion even when using simulations to illustrate major concepts O b. Although 77 intervals capturing p is less than 90, the difference was simply due to chance. Oc The Central Limit Theorem condition of np2 10 and/or n(1 - p) 2 10 does not hold Od. The 100 confidence intervals were not generated randomly.
image below. The student could not explain why he did not see about 90 of the confidence intervals capturing the population proportion of 0.24. Please select the answer choice that provides the best explanation to this student. Confidence intervals for P. p=0.24, Type Standard-Wald Astatistics student ran StatCrunch's confidence interval applet for a proportion with a population proportion of 0.24, à 90% Confiderce levei, Sample sire=12 CI Level Containing p Total Proportion 0.9 100 0.77 77 Jatera I to O a. It is impossible to use a population proportion even when using simulations to illustrate major concepts O b. Although 77 intervals capturing p is less than 90, the difference was simply due to chance. Oc The Central Limit Theorem condition of np2 10 and/or n(1 - p) 2 10 does not hold Od. The 100 confidence intervals were not generated randomly.

Glencoe Algebra 1, Student Edition, 9780079039897, 0079039898, 2018
18th Edition
ISBN:9780079039897
Author:Carter
Publisher:Carter
Chapter10: Statistics
Section10.3: Measures Of Spread
Problem 1GP

Related questions
Question
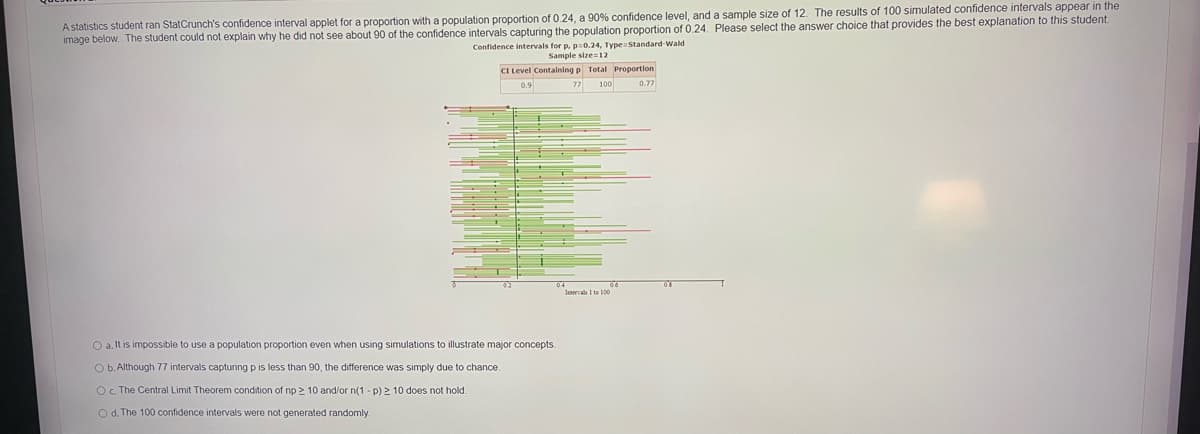
Transcribed Image Text:image below. The student could not explain why he did not see about 90 of the confidence intervals capturing the population proportion of 0.24. Please select the answer choice that provides the best explanation to this student.
Confidence intervals for P. p=0.24, Type Standard-Wald
A statistics student ran StatCrunch's confidence interval applet for a proportion with a population proportion of 0.24, a 90% confidence level, and a sample size of 12. The results of 100 simulated confidence intervals appear in the
Sample size=12
CI Level Contalning p Total Proportion
77
0.9
100
0.77
O a. It is impossible to use a population proportion even when using simulations to illustrate major concepts.
O b. Although 77 intervals capturing p is less than 90, the difference was simply due to chance.
O. The Central Limit Theorem condition of np 2 10 and/or n(1 - p) > 10 does not hold.
O d. The 100 confidence intervals were not generated randomly.
Expert Solution
This question has been solved!
Explore an expertly crafted, step-by-step solution for a thorough understanding of key concepts.

Step by step
Solved in 2 steps

Recommended textbooks for you
Glencoe Algebra 1, Student Edition, 9780079039897…
Algebra
ISBN:
9780079039897
Author:
Carter
Publisher:
McGraw Hill
Glencoe Algebra 1, Student Edition, 9780079039897…
Algebra
ISBN:
9780079039897
Author:
Carter
Publisher:
McGraw Hill