In order to compare the means of two normal populations that are known to have equal variances, independent random samples are taken of sizes n = 10 and n2 data yield: = 15. The results from the sample Sample 1 Sample 2. sample mean = 52 sample mean = 45 S1 = 5 S2 =3 Sp 3.9065 %3D To test the null hypothesis Ho: H1- H2 =0 versus the alternative hypothesis H,: µ1 -µ2 > 0 at the 0.01 level of significance, the most accurate statement is O The value of the test statistic is -8.48 and the critical value is -2.5 O The value of the test statistic is 4.39 and the critical value is 1.96 O The value of the test statistic is -4.39 and the critical value is -1.96 O The value of the test statistic is 3.79 and the critical value is 2.326 E tho test statistic is 8.48 and the critical value is +2,50
In order to compare the means of two normal populations that are known to have equal variances, independent random samples are taken of sizes n = 10 and n2 data yield: = 15. The results from the sample Sample 1 Sample 2. sample mean = 52 sample mean = 45 S1 = 5 S2 =3 Sp 3.9065 %3D To test the null hypothesis Ho: H1- H2 =0 versus the alternative hypothesis H,: µ1 -µ2 > 0 at the 0.01 level of significance, the most accurate statement is O The value of the test statistic is -8.48 and the critical value is -2.5 O The value of the test statistic is 4.39 and the critical value is 1.96 O The value of the test statistic is -4.39 and the critical value is -1.96 O The value of the test statistic is 3.79 and the critical value is 2.326 E tho test statistic is 8.48 and the critical value is +2,50

MATLAB: An Introduction with Applications
6th Edition
ISBN:9781119256830
Author:Amos Gilat
Publisher:Amos Gilat
Chapter1: Starting With Matlab
Section: Chapter Questions
Problem 1P

Related questions
Question
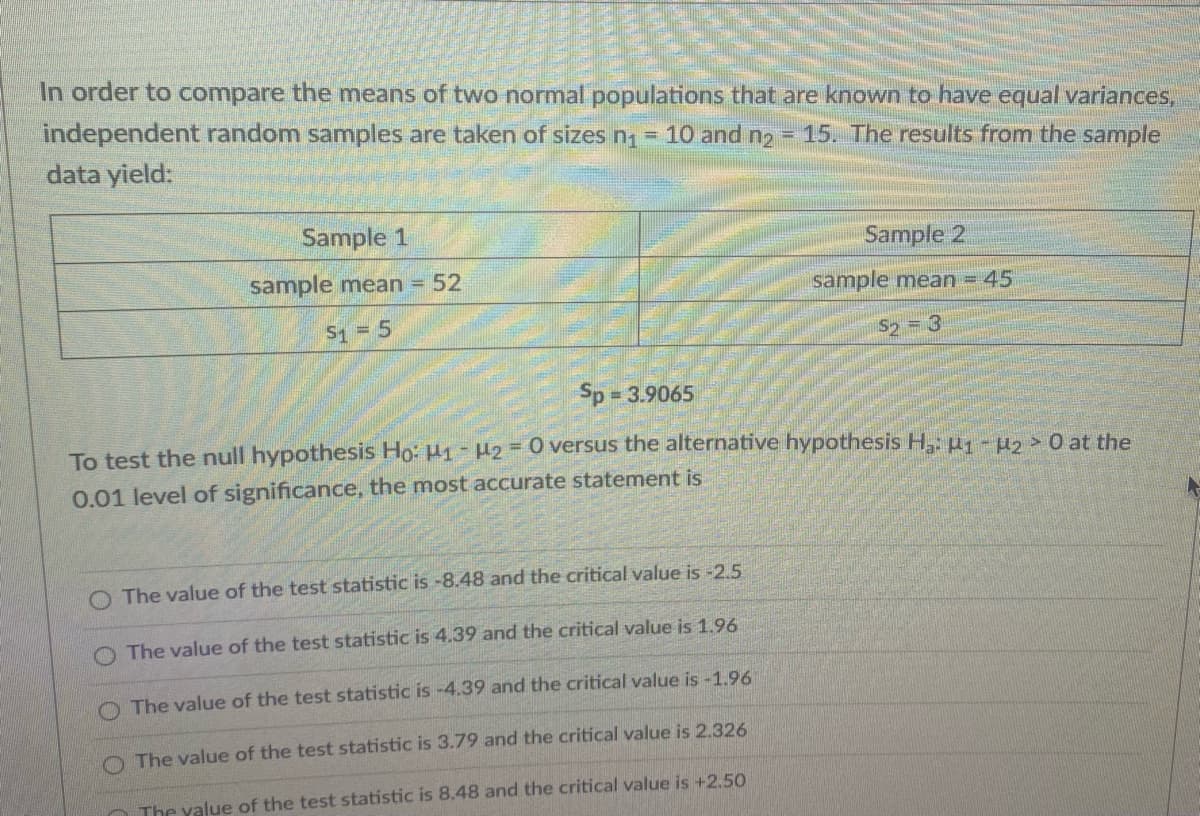
Transcribed Image Text:In order to compare the means of two normal populations that are known to have equal variances,
independent random samples are taken of sizes n1 = 10 and n2
data yield:
= 15. The results from the sample
Sample 1
Sample 2
sample mean = 52
sample mean = 45
S1 5
S2 = 3
Sp 3.9065
%3D
To test the null hypothesis Ho: H1 - H2=0 versus the alternative hypothesis H,: µ1 -µ2> 0 at the
0.01 level of significance, the most accurate statement is
O The value of the test statistic is -8.48 and the critical value is -2.5
O The value of the test statistic is 4.39 and the critical value is 1.96
O The value of the test statistic is -4.39 and the critical value is -1.96
The value of the test statistic is 3.79 and the critical value is 2.326
The value of the test statistic is 8.48 and the critical value is +2,50
Expert Solution
This question has been solved!
Explore an expertly crafted, step-by-step solution for a thorough understanding of key concepts.

Step by step
Solved in 2 steps with 2 images

Recommended textbooks for you
MATLAB: An Introduction with Applications
Statistics
ISBN:
9781119256830
Author:
Amos Gilat
Publisher:
John Wiley & Sons Inc

Probability and Statistics for Engineering and th…
Statistics
ISBN:
9781305251809
Author:
Jay L. Devore
Publisher:
Cengage Learning

Statistics for The Behavioral Sciences (MindTap C…
Statistics
ISBN:
9781305504912
Author:
Frederick J Gravetter, Larry B. Wallnau
Publisher:
Cengage Learning
MATLAB: An Introduction with Applications
Statistics
ISBN:
9781119256830
Author:
Amos Gilat
Publisher:
John Wiley & Sons Inc
Probability and Statistics for Engineering and th…
Statistics
ISBN:
9781305251809
Author:
Jay L. Devore
Publisher:
Cengage Learning
Statistics for The Behavioral Sciences (MindTap C…
Statistics
ISBN:
9781305504912
Author:
Frederick J Gravetter, Larry B. Wallnau
Publisher:
Cengage Learning

Elementary Statistics: Picturing the World (7th E…
Statistics
ISBN:
9780134683416
Author:
Ron Larson, Betsy Farber
Publisher:
PEARSON

The Basic Practice of Statistics
Statistics
ISBN:
9781319042578
Author:
David S. Moore, William I. Notz, Michael A. Fligner
Publisher:
W. H. Freeman

Introduction to the Practice of Statistics
Statistics
ISBN:
9781319013387
Author:
David S. Moore, George P. McCabe, Bruce A. Craig
Publisher:
W. H. Freeman