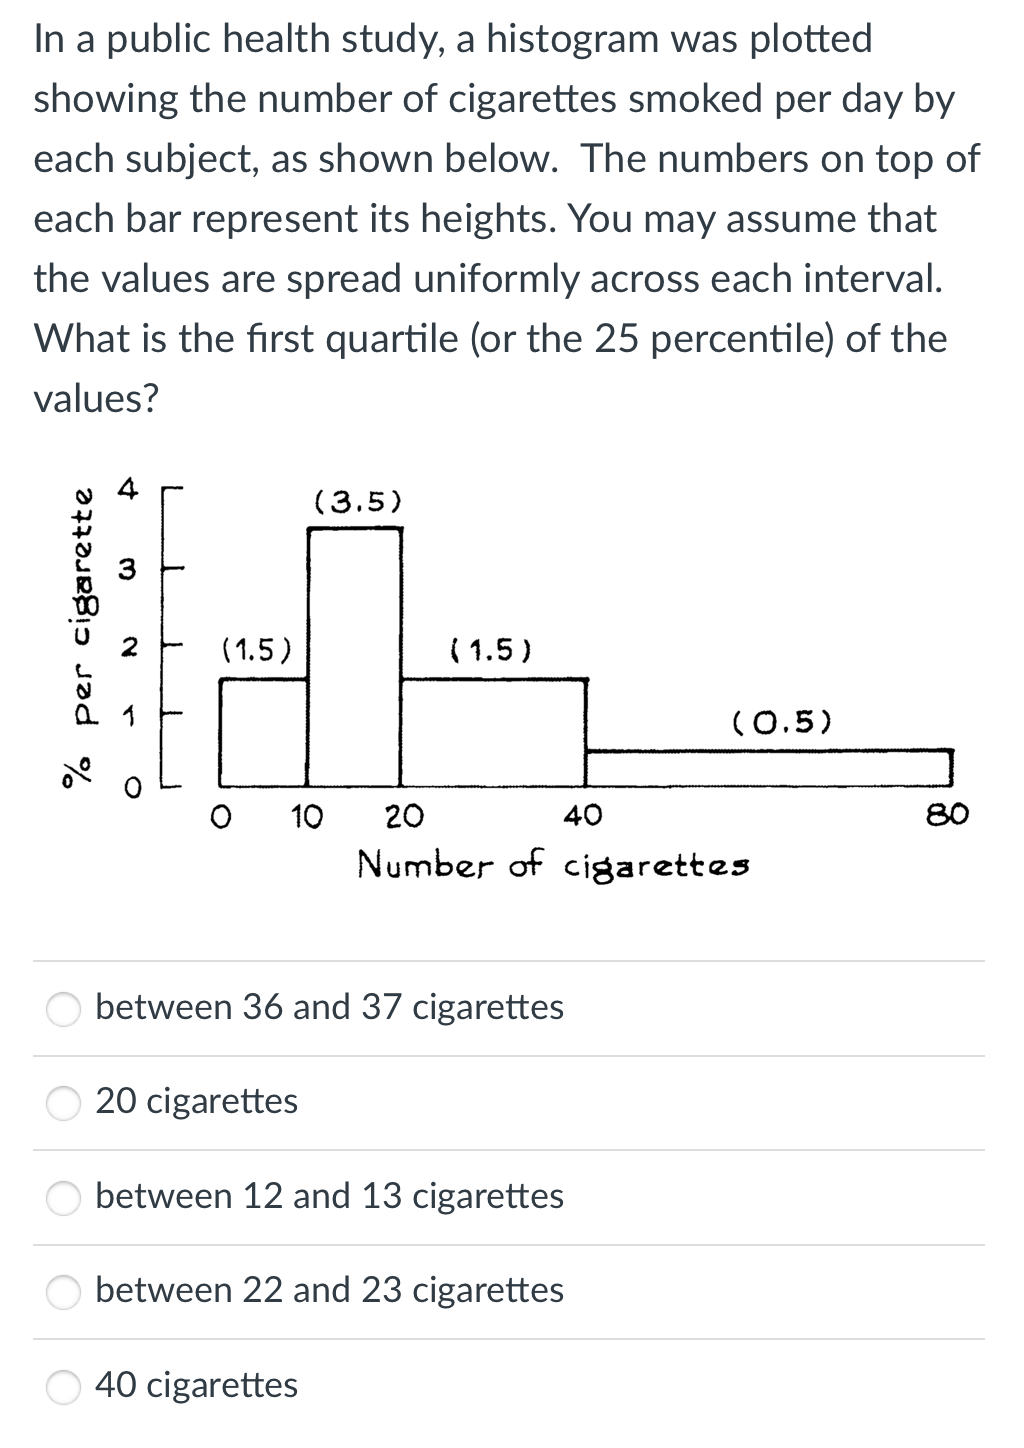
In a public health study, a histogram was plotted showing the number of cigarettes smoked per day by each subject, as shown below. The numbers on top of each bar represent its heights. You may assume that the values are spread uniformly across each interval. What is the first quartile (or the 25 percentile) of the values?
In a public health study, a histogram was plotted showing the number of cigarettes smoked per day by each subject, as shown below. The numbers on top of each bar represent its heights. You may assume that the values are spread uniformly across each interval. What is the first quartile (or the 25 percentile) of the values?

Glencoe Algebra 1, Student Edition, 9780079039897, 0079039898, 2018
18th Edition
ISBN:9780079039897
Author:Carter
Publisher:Carter
Chapter10: Statistics
Section10.5: Comparing Sets Of Data
Problem 13PPS

Related questions
Question
Transcribed Image Text:In a public health study, a histogram was plotted
showing the number of cigarettes smoked per day by
each subject, as shown below. The numbers on top of
each bar represent its heights. You may assume that
the values are spread uniformly across each interval.
What is the first quartile (or the 25 percentile) of the
values?
(3.5)
(1.5)
( 1.5)
(0.5)
10
20
40
80
Number of cigarettes
between 36 and 37 cigarettes
O 20 cigarettes
between 12 and 13 cigarettes
between 22 and 23 cigarettes
O 40 cigarettes
% per cigarette
3.
Expert Solution
This question has been solved!
Explore an expertly crafted, step-by-step solution for a thorough understanding of key concepts.

This is a popular solution!

Trending now
This is a popular solution!

Step by step
Solved in 2 steps

Recommended textbooks for you
Glencoe Algebra 1, Student Edition, 9780079039897…
Algebra
ISBN:
9780079039897
Author:
Carter
Publisher:
McGraw Hill
Glencoe Algebra 1, Student Edition, 9780079039897…
Algebra
ISBN:
9780079039897
Author:
Carter
Publisher:
McGraw Hill