In a recent study conducted by Pulse Measurement Asia, their results show that a higher percentage of females have a normal resting pulse rate compared with males. Dr. Castillejo is interested to know whether this result also applies to gym members. Determine the appropriate test to use and why.
In a recent study conducted by Pulse Measurement Asia, their results show that a higher percentage of females have a normal resting pulse rate compared with males. Dr. Castillejo is interested to know whether this result also applies to gym members. Determine the appropriate test to use and why.

MATLAB: An Introduction with Applications
6th Edition
ISBN:9781119256830
Author:Amos Gilat
Publisher:Amos Gilat
Chapter1: Starting With Matlab
Section: Chapter Questions
Problem 1P

Related questions
Question
In a recent study conducted by Pulse Measurement Asia, their results show that a higher percentage of females have a normal resting pulse rate compared with males. Dr. Castillejo is interested to know whether this result also applies to gym members.
Determine the appropriate test to use and why.
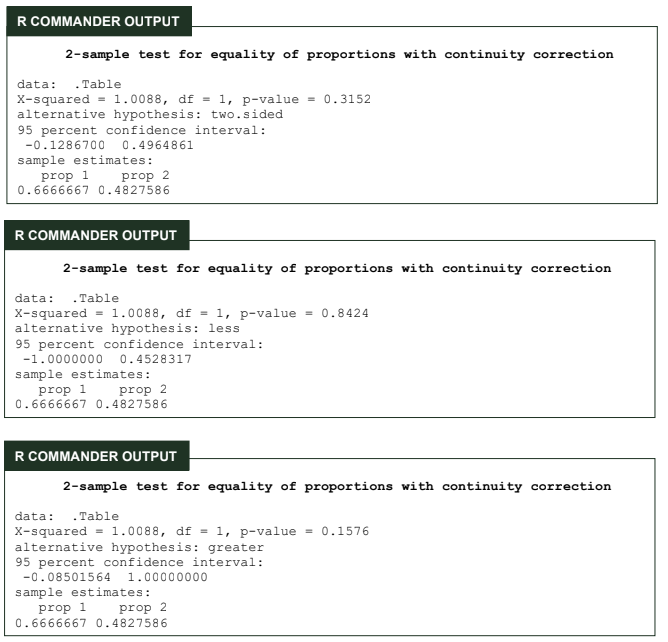
Transcribed Image Text:R COMMANDER OUTPUT
2-sample test for equality of proportions with continuity correction
data: .Table
X-squared = 1.0088, df = 1, p-value - 0.3152
alternative hypothesis : two.sided
95 percent confidence interval:
-0.1286700
0.4964861
sample estimates:
prop 1
0.6666667 0.4827586
prop 2
R COMMANDER OUTPUT
2-sample test for equality of proportions with continuity correction
data: .Table
= 0.8424
X-squared = 1.0088, df = 1, p-value
alternative hypothesis: less
95 percent confidence interval:
-1.0000000
0.4528317
sample estimates:
prop 1
0.6666667 0.4827586
prop 2
R COMMANDER OUTPUT
2-sample test for equality of proportions with continuity correction
data: .Table
X-squared - 1.0088, df = 1, p-value = 0.1576
alternative hypothesis: greater
95 percent confidence interval:
-0.08501564
1.00000000
sample estimates:
prop 1
0.6666667 0.4827586
prop 2
Expert Solution
This question has been solved!
Explore an expertly crafted, step-by-step solution for a thorough understanding of key concepts.

Step by step
Solved in 2 steps

Recommended textbooks for you
MATLAB: An Introduction with Applications
Statistics
ISBN:
9781119256830
Author:
Amos Gilat
Publisher:
John Wiley & Sons Inc

Probability and Statistics for Engineering and th…
Statistics
ISBN:
9781305251809
Author:
Jay L. Devore
Publisher:
Cengage Learning

Statistics for The Behavioral Sciences (MindTap C…
Statistics
ISBN:
9781305504912
Author:
Frederick J Gravetter, Larry B. Wallnau
Publisher:
Cengage Learning
MATLAB: An Introduction with Applications
Statistics
ISBN:
9781119256830
Author:
Amos Gilat
Publisher:
John Wiley & Sons Inc
Probability and Statistics for Engineering and th…
Statistics
ISBN:
9781305251809
Author:
Jay L. Devore
Publisher:
Cengage Learning
Statistics for The Behavioral Sciences (MindTap C…
Statistics
ISBN:
9781305504912
Author:
Frederick J Gravetter, Larry B. Wallnau
Publisher:
Cengage Learning

Elementary Statistics: Picturing the World (7th E…
Statistics
ISBN:
9780134683416
Author:
Ron Larson, Betsy Farber
Publisher:
PEARSON

The Basic Practice of Statistics
Statistics
ISBN:
9781319042578
Author:
David S. Moore, William I. Notz, Michael A. Fligner
Publisher:
W. H. Freeman

Introduction to the Practice of Statistics
Statistics
ISBN:
9781319013387
Author:
David S. Moore, George P. McCabe, Bruce A. Craig
Publisher:
W. H. Freeman