In a recent tennis tournament, women playing singles matches used challenges on 137 calls made by the line judges. Among those challenges, 34 were found to be successful with the call overturned. a. Construct a 99% confidence interval for the percentage of successful challenges. b. Compare the results from part (a) to this 99% confidence interval for the percentage of successful challenges made by the men playing singles matches: 19.3%
In a recent tennis tournament, women playing singles matches used challenges on 137 calls made by the line judges. Among those challenges, 34 were found to be successful with the call overturned. a. Construct a 99% confidence interval for the percentage of successful challenges. b. Compare the results from part (a) to this 99% confidence interval for the percentage of successful challenges made by the men playing singles matches: 19.3%

College Algebra (MindTap Course List)
12th Edition
ISBN:9781305652231
Author:R. David Gustafson, Jeff Hughes
Publisher:R. David Gustafson, Jeff Hughes
Chapter8: Sequences, Series, And Probability
Section8.7: Probability
Problem 6E: List the sample space of each experiment. Tossing three coins

Related questions
Question
Dos

Transcribed Image Text:In a recent tennis tournament, women playing singles matches used challenges on 137 calls made by the line judges. Among those challenges, 34 were found to be
successful with the call overturned.
a. Construct a 99% confidence interval for the percentage of successful challenges.
b. Compare the results from part (a) to this 99% confidence interval for the percentage of successful challenges made by the men playing singles matches:
19.3% <p<37.9%. Does it appear that either gender is more successful than the other?
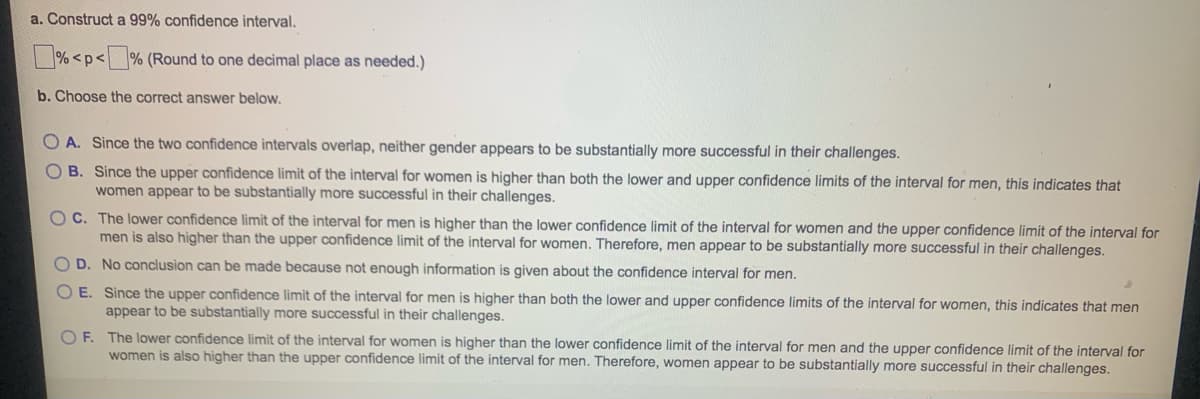
Transcribed Image Text:a. Construct a 99% confidence interval.
%<p<% (Round to one decimal place as needed.)
b. Choose the correct answer below.
OA. Since the two confidence intervals overlap, neither gender appears to be substantially more successful in their challenges.
OB. Since the upper confidence limit of the interval for women is higher than both the lower and upper confidence limits of the interval for men, this indicates that
women appear to be substantially more successful in their challenges.
OC. The lower confidence limit of the interval for men is higher than the lower confidence limit of the interval for women and the upper confidence limit of the interval for
men is also higher than the upper confidence limit of the interval for women. Therefore, men appear to be substantially more successful in their challenges.
O D. No conclusion can be made because not enough information is given about the confidence interval for men.
OE. Since the upper confidence limit of the interval for men is higher than both the lower and upper confidence limits of the interval for women, this indicates that men
appear to be substantially more successful in their challenges.
OF. The lower confidence limit of the interval for women is higher than the lower confidence limit of the interval for men and the upper confidence limit of the interval for
women is also higher than the upper confidence limit of the interval for men. Therefore, women appear to be substantially more successful in their challenges.
Expert Solution
This question has been solved!
Explore an expertly crafted, step-by-step solution for a thorough understanding of key concepts.

This is a popular solution!

Trending now
This is a popular solution!

Step by step
Solved in 3 steps

Recommended textbooks for you
College Algebra (MindTap Course List)
Algebra
ISBN:
9781305652231
Author:
R. David Gustafson, Jeff Hughes
Publisher:
Cengage Learning

Glencoe Algebra 1, Student Edition, 9780079039897…
Algebra
ISBN:
9780079039897
Author:
Carter
Publisher:
McGraw Hill
College Algebra (MindTap Course List)
Algebra
ISBN:
9781305652231
Author:
R. David Gustafson, Jeff Hughes
Publisher:
Cengage Learning
Glencoe Algebra 1, Student Edition, 9780079039897…
Algebra
ISBN:
9780079039897
Author:
Carter
Publisher:
McGraw Hill