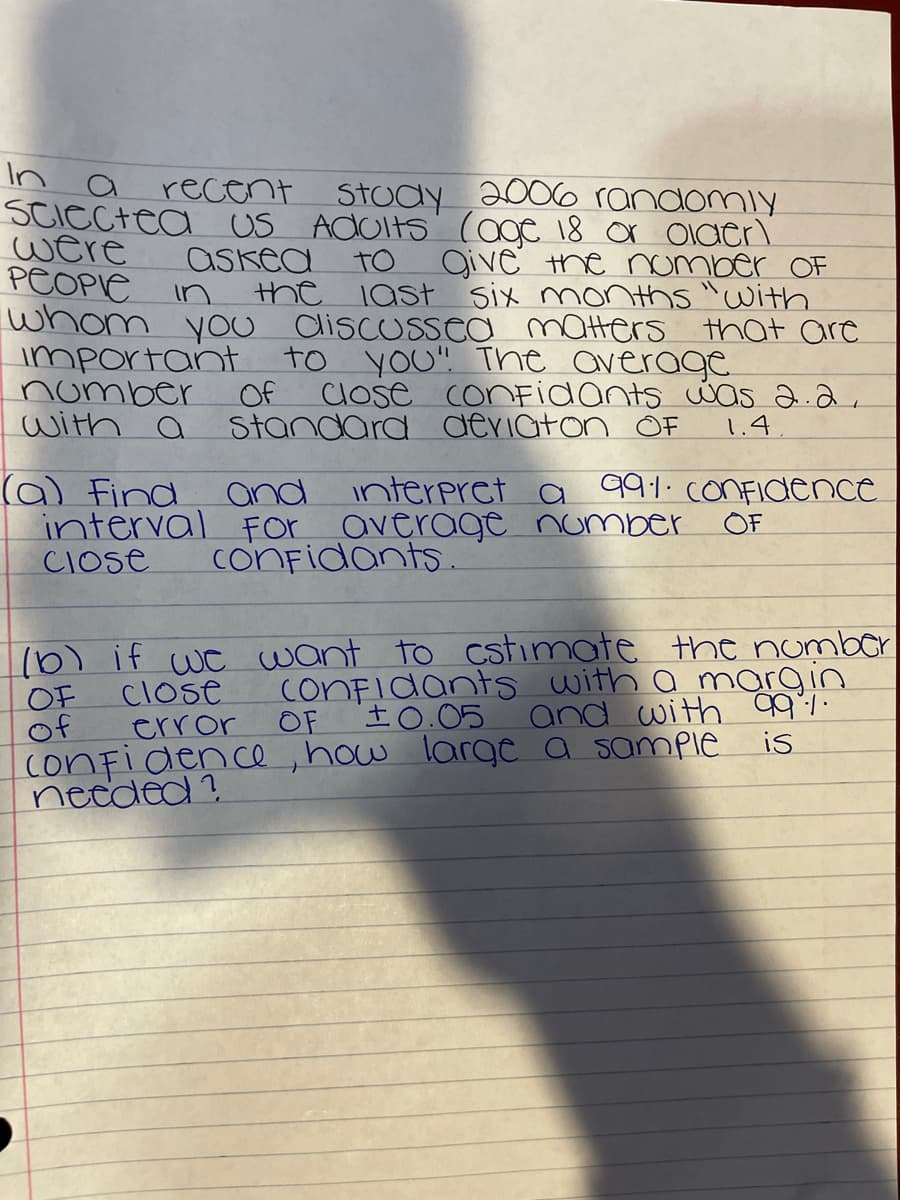
In a SCICCtea were PCOPIE whom yOU dliscusea matters that are recent Study 2006 randomly US Adolts' (oge 18 or Olaer) askea to the last six months "with give the nomber OF in to you! The average Of Standard deriaton OF lose conFidants was 2.2, number with a 1.4 (a) Find interpret ca 99:1. conFIdenca and


Q: In a poll, 1.004 adults in a country were asked whether they favor or oppose the use of ederal tax…
A: Solution: From the given information, the number of number of adults participated in the poll is…
Q: A dietician read in a survey that 85.36% of adults in the U.S. do not eat breakfast at least 3 days…
A:
Q: The owner of a local nightclub has recently surveyed a random sample c customers of the club. She…
A: As the population standard deviation is not known, we will use t distribution. The following null…
Q: According to a prestigious historical society, in 1999, 7.2% of recent high school graduates believe…
A: Given, Proportion of population who believed that the Romans invented mayonnaise P=7.2%=0.072 Sample…
Q: The experiment is to toss two balls into four boxes in such a way that each ball is equally likely…
A: Given, An experiment is to toss two balls into four boxes in such a way that each ball is equally…
Q: A medical researcher says that at least 23% of Canadian adults are smokers.In a random sample of 200…
A: The null hypothesis is a simple statement about the value of the population parameter which is…
Q: Nationally, 83% of Americans have earned a high school diploma. We want to see if the proportion of…
A: Given, Nationally, 83% of Americans have earned a high school diploma. We want to see if the…
Q: 2. A bank randomly looks at loon applications and checks them for errors, Ten applications and the…
A: A bank randomly looks at loan applications and checks for the errors. Data is: Application…
Q: A research center claims that 31% of adults in a certain oountry would travel into space on a…
A:
Q: A samp s chosen. It was found that among engineering majors, 70% are male. nd among English majors,…
A: Q
Q: An education researcher claims that at most 3% of working college students are employed as teachers…
A: Solution: From the given information, p-hat=0.04 and n=200. The given claim is that at most 3% of…
Q: According to the Pew Research Center, 68% of parents have taken away their teen's cellphone and…
A: Given data number of success , x= 355 sample size, n =500 population proportion,p=…
Q: A research center claims that less than 50% of senior high school students in publics chools in the…
A: Given values, State the null and alternate hypothesis.
Q: A recent year was randomly picked from. Researchers conducted a study to find out if there is a…
A: Solution: It is given that, at Cabrillo College, there were 2051 Hispanic students out of a total of…
Q: At a local university, English instructors are supposed to grade essays in a class so that the…
A: Given, Sample size = 22 Sample mean = 79.1 Sample standard deviation = 6.5
Q: Suppose that a poll taken 10 years ago found that 56% of parents spank their children. Suppose a…
A: In a poll 10 years ago it is found that 56% of parents spank their children.
Q: s published that 45% of college seniors want to learn more sbout ere is no differene een before aud…
A: Given: Sample size, n=65 No. of seniors want to learn more about financial literacy, x=35
Q: The weights of a random sample of 15 marathon runners were taken before and after running a marathon…
A:
Q: If 4% of the bottles produced by a company are defective.determine the probabilkities of sample that…
A: Given,n=100p=0.04q=1-p=1-0.04=0.96x=no. of defectivesx~Binomial(n=100,p=0.04)P(X=x)=Cxn px qn-x ;…
Q: THE MEAN ACT MATHEMATICS SCORE FOR 60 HIGHSCHOOL STUDENTS IS 20.6. ASSUME POI STAND DEV IS 5.4. THE…
A: Suppose the sample xi, (i=1,2,...,n1) of size n1 has been drawn from the population with mean μ1 and…
Q: A medical researcher says that less than 25% of adults in a certain country are smokers. In a…
A: Given information Total no of adults = 250
Q: A sample of 800 truck drivers from Minnesota were interviewed randomly and 316 answered they like…
A:
Q: The following paragrapli was extracted from a news article with headline "Increased risk for…
A: Given that among the confirmed Covid-19 cases, 7.9% were patients with cancer, which was higher than…
Q: The manufacturer of a new drug claims that it will lower blood pressure by 13 points on the average.…
A: Given that: Data points [12.0, 8.0, 15.0, 9.0, 10.0, 16.0] From Data points we get following: x̄=…
Q: A second-stage smog alert has been called in a certain area of Los Angeles County in which there are…
A: If the sample size if fixed and the experiment drawn with replacement, the experiment follows…
Q: The weights of a random sample of 15 marathon runners were taken before and after running a marathon…
A: Null and alternate hypotheses: The data represents the weights of a random sample of 15 marathon…
Q: In a study of red/green color blindness, 700 men and 2100 women are randomly selected and tested.…
A: Hi there! Thanks for the question. Since, there are multiple subparts we have solved for three…
Q: A second-stage smog alert has been called in a certain area of Los Angeles County in which there are…
A: Given, Total number of industrial firms = 50 The selected firms for inspection = 10 To…
Q: An education researcher claims that at most 4% of working college students are employed as teachers…
A: Here one proportion Z test is applicable , Where , n = 400 given
Q: The president of a local college reported that more than 25% of the students received a…
A: Solution: State the hypotheses Null hypothesis: That is, proportion of the students have…
Q: We poll 150 people and find that 70% favor Candidate S. In order to estimate with 90% confidence the…
A: Given that,150 people and 70% favor candidate S.
Q: A particular exchange has been dimensioned to handle 1000 calls during the BH. On a certain day…
A: Number of Calls offered = 1100 Capacity to handle number of calls = 1000
Q: A study showed that every 100 grams of red meat consumed per day increases the risk of colorectal…
A: Given: 1 in 20 American men will develop colorectal cancer in their lifetime. To find: 1) Write the…
Q: Astudy was conduccled to determine the proportion of people who dream in black and white instead of…
A: Given , People over age 55 : Sample size = n1 = 317 Number of people who dream in black and white =…
Q: A recent study claims that 40% of registered voters associate themselves with Democrats. 35% with…
A: There are 5 cases which are named as democrats, republicans, independent, green party and social…
Q: a) Illustrate the given situation using a Venn diagram b) What proportion of those twelve hundred…
A: here given , A total of twelve hundred graduates of State Tech have gotten into medical school in…
Q: A magazine claims that 75% ofall teenage boys have their own radios. A researcher wished to test the…
A: It is given the sample size (n) is 60 teenage boys and the 54 boys had their own radios. That is,…
Q: Calculateaconfidenceinterval for the me-dian ofthe second population.Select your confidenc eleve…
A:
Q: A research center claims that 30% of adults in a certain country would travel into space on a…
A: Given , Sample size = n = 1200 Sample proportion = p^ = 33% = 0.33 a) Claim : 30% of adults in a…
Q: A medical researcher says that 25% of U.S. adults are smokers. In a random sample of 272 US. adults,…
A:
Q: A group of doctors published an article in the New England Journal of Medicine. In the article they…
A: Solution: Given information: n1= 367 Sample size of assigned to surgery n2= 364 Sample size of…
Q: Shuster (1991) describes an case involving the sale of cc packets of cocaine, of which actually be…
A: Solution
Q: A gas station owner believes that gas is sold to an equal number of customers each day. Using a…
A:
Q: A researcher claims that 89% of people sleep with a pillow. In a random sample of 1000 people, 825…
A: The null and alternative hypothesis is given by; H0: p=0.89Ha: p≠0.89The given level of significance…
Q: n a study of red/green color blindness, 700 men and 2100 women are randomly selected and tested.…
A: Note: Hi there! Thank you for posting the question. As there are multiple sub parts, according to…
Q: A humane society claims that less than 69% of households in a certain country own a pet. In a…
A: Given, α=0.10 A random sample of size n=700 The no. of household who say they own a pet is X=455 The…
Q: A city official claims that the proportion of all commuters who are in favor of an expandedpublic…
A: A city official claims that the proportion of all commuters who are in favor of an expanded public…
Q: The weights of a random sample of 15 marathon runners were taken before and after running a marathon…
A: From the R commands, mean(after-before)=-3.18667 sd(after-before)=5.844762
Q: A random sample of 16 statistics examinations from a large population was taken. If5 students scored…
A: Here use z test of proportion
Q: To decide on the number of service counters needed for stores to be built in the future, a…
A: a.The stem and leaf plot for the given data is constructed using R:R-Code:

Step by step
Solved in 2 steps


- Is the proportion of wildfires caused by humans in the south different from the proportion of wildfires caused by humans in the west? 350 of the 519 randomly selected wildfires looked at in the south were caused by humans while 383 of the 500 randomly selected wildfires looked at the west were caused by humans. What can be concluded at the = 0.01 level of significance? Please select ans asnwer from the following. Thus, the final conclusion is that ... The results are statistically insignificant at αα = 0.01, so there is insufficient evidence to conclude that the population proportion of wildfires caused by humans in the south is different from the population proportion of wildfires caused by humans in the west. The results are statistically significant at αα = 0.01, so there is sufficient evidence to conclude that the proportion of the 519 wildfires that were caused by humans in the south is different from the proportion of the 500 wildfires that were caused by humans in the…A state policeman has a pet theory that people who drive red cars are more likely to drive too fast. Onhis day off, he borrows one of the department’s radar guns, parks his car in a rest area, and measures theproportion of red cars that are driving too fast. (He decides ahead of time to define “driving too fast” asexceeding the speed limit by more than 5 miles per hour.) To produce a random sample, he rolls a dieand only includes a car in his sample if he rolls a 5 or a 6. He finds that 18 of 28 red cars are driving toofast, and 75 of 205 other cars are driving too fast. please run a 4 step process(significance test) and interperet the P-value for ap statsThe National Institute of Mental Health published an article stating that in any one-year period, approximately 9.5 percent of American adults suffer from depression or a depressive illness. Suppose that in a survey of 100 people in a certain town, seven of them suffered from depression or a depressive illness. Conduct a hypothesis test to determine if the true proportion of people in that town suffering from depression or a depressive illness is lower than the percent in the general adult American population. Is this a test of one mean or proportion? State the null and alternative hypotheses.H0: ____________________ Ha: ____________________ Is this a right-tailed, left-tailed, or two-tailed test? What symbol represents the random variable for this test? In words, define the random variable for this test. Calculate the following: x = ________________ n = ________________ p′p′ = _____________ Calculate σx = __________. Show the formula set-up. State the distribution to use for the…
- . The National Institute of Mental Health published an article stating that in any one-year period, approximately 9.5 percent of American adults suffer from depression or a depressive illness. Suppose that in a survey of 100 people in a certain town, seven of them suffered from depression or a depressive illness. Conduct a hypothesis test to determine if the true proportion of people in that town suffering from depression or a depressive illness is lower than the percent in the general adult American population. Is this a test of one mean or proportion? State the null and alternative hypotheses.H0: ____________________ Ha: ____________________ Is this a right-tailed, left-tailed, or two-tailed test? What symbol represents the random variable for this test? In words, define the random variable for this test. Calculate the following: x = ________________ n = ________________ p′p′ = _____________ Calculate σx = __________. Show the formula set-up. State the distribution to use for…Are there less children diagnosed with Autism Spectrum Disorder (ASD) in states that have larger urban areas over states that are mostly rural? Assume data were collected from a fairly urban state and they found 167 eight-year olds diagnosed with ASD out of 18922 eight-year olds evaluated. Assume data were then collected for a fairly rural state and they found 68 eight-year olds diagnosed with ASD out of 2989 eight-year olds evaluated. Is there enough evidence to show that the proportion of children diagnosed with ASD in the fairly urban state is lower than the proportion in the fairly rural state? Test at the 3% level and Compute a 94% confidence interval for the difference in proportions. (round to 3 decimal points)Based on information from a large insurance company, 66% of all damage liability claims are made by single people under the age of 25. A random sample of 51 claims showed that 43 were made by single people under the age of 25. Does this indicate that the insurance claims of single people under the age of 25 is higher than the national percent reported by the large insurance company? Give the test statistic and your conclusion.
- A major credit card company is investigating whether the distribution of the number of credit cards used by its customers has changed from last year to this year. Customers are classified as using 1 card, 2 cards, or more than 2 cards. The company conducts a chi-square goodness-of-fit test to investigate whether there is a change in the distribution of number of cards used from last year to this year. The value of the chi-square test statistic was χ2=7.82χ2=7.82 with a corresponding pp-value of 0.02. Assuming the conditions for inference were met, which of the following is the correct interpretation of this pp-value?A sample of marriage licenses in St Lawrence County in Upstate New York gives theages of husbands and wives at the time of marriage for 105 newly married couples.The question of interest is whether or not husbands tend to be older than their wives.Use Statkey and statistical inference to address this issue based on the questionsbelow. In all cases be sure to interpret your findings in the context of this problem,stating to what population (if any) your findings apply.1) When getting married, is the average age for husbands greater than the averageage for wives? (Statkey: Use Descriptive Statistics for Two Quantitative Variables)2) Is the proportion of couples for which the husband is older greater than 50%?3) For any significant results, construct and interpret an interval for the size of theeffect. (Statkey: Use Confidence Interval for a Proportion)4) Do you expect the correlation between the ages at marriage of husbands andwives to be positive, negative, or near zero? Explain.5)…Suppose taxpayers calling the IRS in 2017 waited 13 minutes on average for an IRS telephone assister to answer. Do callers who use the IRS help line early in the day have a shorter wait? Suppose a sample of 65 callers who placed their calls to the IRS in the first 30 minutes that the line is open during the day have a mean waiting time of 11 minutes before an IRS telephone assister answers. Based on data from past years, you decide that it is reasonable to assume that the standard deviation of waiting times is 8 minutes. Using these sample results, can you conclude that the waiting time for calls placed during the first 30 minutes the IRS help line is open each day is significantly less that the overall mean waiting time of 13 minutes? Use ? = 0.05. State the null and alternative hypotheses. (Enter != for ≠ as needed.) H0: Ha: Find the value of the test statistic. (Round your answer to two decimal places.) ( ) Find the p-value. (Round your answer to four decimal…
- In October, 1994, a flaw in a certain Pentium chipinstalled in computers was discovered that could result ina wrong answer when performing a division. The manufacturerinitially claimed that the chance of any particulardivision being incorrect was only 1 in 9 billion, so that itwould take thousands of years before a typical userencountered a mistake. However, statisticians are nottypical users; some modern statistical techniques are socomputationally intensive that a billion divisions over ashort time period is not outside the realm of possibility.Assuming that the 1 in 9 billion figure is correct and thatresults of different divisions are independent of oneanother, what is the probability that at least one erroroccurs in one billion divisions with this chip?An organization published an article stating that in any one-year period, approximately 11.5 percent of adults in a country suffer from depression or a depressive illness. Suppose that in a survey of 100 people in a certain town, nine of them suffered from depression or a depressive illness. Conduct a hypothesis test to determine if the true proportion of people in that town suffering from depression or a depressive illness is lower than the percent in the general adult population in the country. Is this a test of one mean or proportion? State the null and alternative hypotheses Is this a right-tailed, left-tailed, or two-tailed test? What symbol represents the random variable for this test? In words, define the random variable for this test. Calculate the following : X= , N= , P= . Calculate σx. (Round your answer to three decimal places.)/ Show the formula set-up. State the distribution to use for the hypothesis test. Find the p-value. (Round your answer to four decimal places.)…Suppose an insurance company wishes to determine if the amount of time a patient spends in the hospital is affected by whether or not the patient has medical insurance. The insurance company suspects that since insurance pays most of the hospital bills, a doctor might keep a person who has insurance in the hospital longer than if that person had to pay all of the expenses because he/she did not have insurance. In order to test these suspicions, the company randomly samples the average stay (in days) of both insured and uninsured patients in a number of hospitals and comes up with the following data. Assume the patient data are normally distributed and the population standard deviations are equal. (sorry this is the best example I can give for the problem) the numbers are actually supposed to be on the lower right side (like a square root I guess) Insurance: xbar 1=17.3, s1 =1.2, n1=29 No Insurance: xbar 2=15.1, s2=2.1, n2=15 Does the data provide sufficient evidence to support the…


