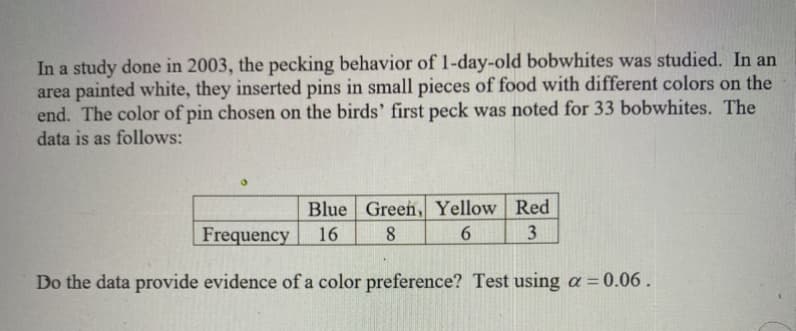
In a study done in 2003, the pecking behavior of 1-day-old bobwhites was studied. In an area painted white, they inserted pins in small pieces of food with different colors on the end. The color of pin chosen on the birds' first peck was noted for 33 bobwhites. The data is as follows: Blue Green, Yellow Red Frequency 16 8 6. 3 Do the data provide evidence of a color preference? Test using a =0.06 .


Q: A researcher used a sample of n = 50 individuals to determine whether they are any preferences…
A: The chi-square test statistics is The number of samples n = 50 The degrees of freedom is df = n -…
Q: 1a. Suppose that a survey has been undertaken to determine if there is a relationship between place…
A: Since you have asked multiple question, according to our guidelines we will solve the first question…
Q: The following table shows the frequency of outcomes when two distinguishable coins were tossed 5,000…
A: Given that Frequency distribution table. Outcome frequency HH 1200 HT 950 TH 1600 TT…
Q: od festival organizer is interested in whether there is a relationship between the number of…
A: The chi square test of independence is used to test a sample of population and is used to assign the…
Q: A market analysis wishes to see whether consumers have any preference between five different flavors…
A: The null and alternative hypotheses are stated below:Null hypothesis:The consumers have preference…
Q: In an article "Shelf-Space Strategy in Retailing," published in Proceedings: Southern Marketing…
A:
Q: Researchers examined whether playing motion-sensing versus non- motion sensing games would affect…
A: Given information: Given data represents the ANOVA output.
Q: A political pollster selects a random sample of 75 registered voters from Allegheny County,…
A: Chi-square test: The hypothesis testing is carried out to check whether there is any relationship…
Q: Saeko owns a yarn shop and want to expands her color selection. Before she expands her…
A:
Q: A random sample of 1952 Texas government employees were selected for a study on race. The table…
A:
Q: From a poll of 900 television viewers, the following data have been accumulated as to their levels…
A: There are two categorical variables which are selection of a TV station and level of education. We…
Q: A soft drink company is interested in knowing whether there is a relationship between cola…
A: Computation of Expected values:
Q: The following table reported the results of a survey on how members would prefer to receive ballots…
A: It is needed to check, whether there is association between gender and preference. The null and…
Q: If a correlated groups t test has 35 participants, the degrees of freedom is?
A: The number of participants in the correlated groups is 35.
Q: A communications company has developed three new designs for a cell phone. To evaluate consumer…
A: Given data : Design 1 Design 2 Design 3 54 38 28 Sample size = n = 120
Q: Complete the following sentence. Pencil Color Number Distributed Color Preference Frequency red 4…
A: Frequency of colors are given in the distribution table. To find the probability of preferring…
Q: In a random survey, 20 seventh graders and 32 eighth graders are asked their preference on playing…
A: A two way frequency table is a visual representation of possible relation between set of data s.…
Q: A random sample of 405 people was selected and they were asked a variety of questions including…
A: First we find Expected values for every Observations. We know that, Chi-square= summation (Oi-…
Q: A seafood festival organizer is interested in whether there is a relationship between the number of…
A: Given: A seafood festival organizer is interested in whether there is a relationship between the…
Q: In a study of color perception, 180 men are tested, and 18 are found to have red/green color…
A: Given : n = 180 x = 18 p^ = 18/180 = 0.1
Q: A researcher obtained a random sample of n = 60 students to determine whether there were any…
A: State the hypotheses.
Q: Is type of beverage ordered with lunch at a restaurant independent of the age of the consumers? A…
A: The null and alternative hypotheses for the test are: H0: Type of beverage ordered with lunch and…
Q: A soft drink company is interested in knowing whether there is a relationship between cola…
A:
Q: Find the mode(s) of the following dataset, which represents the results of a survey of 50 people…
A: Given data, Find the Modes of the following data set?
Q: Which measure of central tendency would be preferred for each of the following variables (from the…
A: Central tendency have mean , median and mode. mean = It is the average value of the data set. median…
Q: 1. The following data shows the changed response scores of three groups on the Edwards Personal…
A: Given: The changed response scores of the three groups on the Edwards Personal Preference Schedule.…
Q: Suppose that a survey has been undertaken to determine if there is a relationship between place of…
A: In order to determine whether there is a relationship between place of residence and automobile…
Q: M&M/MARS, makers of M&M chocolate candies, conducted a national poll in which more than 10 million…
A:
Q: The chi square statistics please answer and show work on solving x2 critical value and x2
A: Chi-square test for goodness of fit: The goodness of fit test is applied to check how well the…
Q: A marketing director for a beverage company conducted a study to investigate people’s soda…
A:
Q: A soft drink company is interested in knowing whether there is a relationship between cola…
A: Level of significance: From the given information, α=0.025 Claim: Test whether there is any…
Q: A consumer preference study compares the effects of three different bottle designs (A B, and ) on…
A: From the given ANOVA table: sample, n = 15 3 different bottle designs = A, B, C 5 of these are…
Q: A sample of employees at a large chemical plant was asked to indicate a preference for one of three…
A:
Q: A political pollster selects a random sample of 75 registered voters from Allegheny County,…
A: Solution Given table is the 2× 3 contingency table.
Q: From the previous market survey on five different types of soft dringk A, B , C, D and E conducted…
A: Given: 17% customers prefer A, 10% prefer B, 20% prefer C, 25% prefer D and 28% prefer E Number of…
Q: Please show work on your answer. Thank you
A: Chi-square test for goodness of fit: The goodness of fit test is applied to check how well the…
Q: Hello. Could anyone help me on this question? I have tried it four times and only one attempt left.…
A:
Q: . A milk producers union wishes to test whether the preference pattern of consumers tor its products…
A:
Q: A report included data from a study in which 789 people in a representative sample of college…
A: There are two variables which are sex and how students perceive their money management skills. We…
Q: A researcher used a sample of n= 25 individuals to determine whether they are any preferences…
A: Note: As per the guidelines, answer to one question at a time can be provided. Given information:…
Q: Marketing research has indicated that males and females may have different color preferences in…
A: Given that, Marketing research has indicated that males and females may have different color…
Q: A study was conducted to determine how people get jobs. The table below lists data from 400 randomly…
A:
Q: Scenario 6 Birds use color to select and avoid certain types of food. The authors of a particular…
A: Chi square χ2 goodness of fit test compares the distribution of proportions in each category…
Q: The following table shows the cumulative frequency distribution of the preferred length of kitchen…
A: Given data is : Length (in meters) more than 1.0 1.5 2.0 2.5 3.0 3.5Housewives…
Q: A fitness magazine surveyed a group of young adults regarding their exercise programs and the…
A: The results obtained from the fitness magazine surveyed a group of young adults regarding their…
Q: A movie theater recorded the type of snack item purchased and the type of movie the customer was…
A:
Q: A researcher has developed three different designs for a computer keyboard. A sample of n=60…
A: given, there are 3 categories Design A Design B Design C We know that Df= ( numbers of…
Q: A consumer preference study compares the effects of three different bottle designs (A, B, and C9 on…
A: Hello! As you have posted more than 3 sub parts, we are answering the first 3 sub-parts. In case…
Q: Does the presence of popular cartoon characters on food packages influence children's food choices?…
A: Introduction: In a study, the individuals are the units on whom the actual data are collected, and…
Q: A sample of employees at a large chemical plant was asked to indicate a preference for one of three…
A: Chi-square Analysis: A statistical approach for comparing the differences between predicted and…

Step by step
Solved in 3 steps with 1 images


- 1. A company manager hired an economicresearcher to study watch preference of theprospective customers. The researchersampled 30 customers and each is classifiedby age and watch type preference (digital vsanalog). Using the following data, determineif there is an association between age andwatch preference using your SPSS software:From the previous market survey on five different types of soft dringk A, B , C, D and E conducted in 2010, it is evident that 17% customers prefer A, 10% prefer B, 20% prefer C, 25% prefer D and rest of them prefer E. The company is intended to examine whether the current distribution of preference for these products differ from the 2010 preference. In a recent market survey on 200 custmers, each was asked which one he/she prefer. The results were as follows: 40 prefer drink A; 47 prefer B; 38 drink C; 35 prefer D, and 40 prefer E. Test whether the current distribution of preference differ from the existing distribution of preference. Use 5% level of significance for your conclusion. Show the p-value in graph.The owner of an ice cream shop claims that 40% of his customers prefer chocolate ice cream, 35% prefer vanilla ice cream, 15% prefer strawberry ice cream, and 10% prefer mint ice cream. One of his employees wishes to test this claim. The employee randomly selects 100 customers and asks them about their preferred ice cream flavor. The following table shows the preference of each of the 100 surveyed respondents. Chocolate vanilla strawberry mint 34 31 25 10 Assuming the requirements for the procedure have been met, which of the following procedures should the employee use to test the owner's claim about his customers' ice cream preferences? - chi-square test for homogeneity -chi-square goodness-of-fit test -chi-square test for independence -one-sample ?‑test for a mean -one-sample ?‑test for a proportion
- The marketing department of your game making company wants to determine if socioeconomic status isrelated to game playing preferences. 100 children, in total, were identified from families of low, middle,and high socioeconomic status and asked to select on of Monopoly, Battleship, or Connect Four. Theresults are shown in the table below. Is there evidence that socioeconomic status is related to gameplaying preference? Use ? = 0.05. Clearly state your hypotheses and provide the relevant p-valueA communications company has developed three new designs for a cell phone. To evaluate consumer response, a sample of 120 college students is selected and each student is given all three phones to use for one week. At the end of the week, the students must identify which of the three designs they prefer. The distribution of preference is as follows: Do the results indicate any significant preferences among the three designs? Compute Cohen’s w to measure the size of the effect.For a class project, a group of students were curious if there was a connection between color preferences and movie preferences (e.g., if people who liked brighter colors preferred uplifting/funny movies and people who liked darker colors liked dramas). Participants in the study were first asked them to select which color they most preferred, choosing between: red, blue, yellow, or green. Next, participants watched the movie Everything Everywhere All at Once and were asked to give it a rating between 0 and 100. Later, the students tested whether there was a difference in rating based on color preference. Which of the following analyses would BEST apply to this study?
- Marketing research has indicated that males and females may have different color preferences in visual advertising with males preferring brighter colors and females preferring softer tones. To test this theory, researchers surveyed females and males by asking them to rate two different visual advertisements for clothing items with the first ad primarily having bright red and blue lettering and graphics and the second primarily having pastel blue and yellow lettering and graphics. The results were as follows. Preferred BrightBlue and Red Preferred PastelBlue and Yellow Total Males 91 49 140 Females 74 71 145 (b) Calculate the test statistic. (Round your answer to two decimal places.) (c) Find the P-value for this data. (Use a table or technology. Round your answer to four decimal places.)A survey was taken at a nursing home regarding preferences in music and it was found that: 12 listen to western 11 listen to classical 14 listen to jazz 8 listen to western and jazz 9 listen to jazz and classical, 5 listen to western and classical 8 listen to none of these 3 listen to all three. How many people were surveyed?A random sample of statistics professors was asked to complete a survey including questions on curriculum content, computer integration, and software preferences. Of the 250 responses, 100 professors indicated that they preferred software package M and 80 preferred software package E, whereas the remainder were evenly split between preference for software package S and software package P. Do the data indicate that professors have a preference for any of these software packages?
- In a survey, 180 consumers were asked about their buying preferences concerning a product that is sold in the market under three labels. The results were as follows. 13 buy only those sold under label A.25 buy only those sold under label B.25 buy only those sold under label C.13 buy only those sold under labels A and B.10 buy only those sold under labels A and C.11 buy only those sold under labels B and C.10 buy the product sold under all three labels. How many of the consumers surveyed buy the product sold under (a) At least one of the three labels? consumers(b) Labels A and B but not C? consumers(c) Label A? consumers(d) None of these labels? consumersA developmental psychologist would like to determine whether infants display any color preferences. A stimulus consisting of four color patches (red, green, blue, and yellow) is projected onto the ceiling above a crib. Infants are placed in the crib, one at a time, and the psychologist records how much time each infant spends looking at each of the four colors. The color that receives the most attention during a 100-second test period is identified as the preferred color for that infant. The preferred colors for a sample of 80 infants are shown in the following table: Red Green Blue Yellow 25 18 23 14 a. Do the data indicate any significant preferences among the four colors? Test at the .05 level of significance. b. Write a sentence demonstrating how the outcome of the hypothesis test would appear in a research report.4.A researcher used a sample of n = 50 individuals to determine whether they are any preferences between two new designs for a smart phone (iphone vs samsung) depending on whether they have a PC or Mac computer. If the data produce a chi-square statistic of χ2 = 7.00 what decision should the researcher make? a.There is a significant preference at both α = .05 and α = .01. b.There is no significant preference at α = .05 but there is at α = .01. c.There is a significant preference at α = .05 but not at α = .01. d.There is no significant preference at either α = .05 or α = .01.