In addition, three of the cells have blanks beneath the observed frequencies. Fill in these blanks with the frequencies expected if the two variables, response to Question 17 and student's major school, are independent.
In addition, three of the cells have blanks beneath the observed frequencies. Fill in these blanks with the frequencies expected if the two variables, response to Question 17 and student's major school, are independent.

MATLAB: An Introduction with Applications
6th Edition
ISBN:9781119256830
Author:Amos Gilat
Publisher:Amos Gilat
Chapter1: Starting With Matlab
Section: Chapter Questions
Problem 1P

Related questions
Question
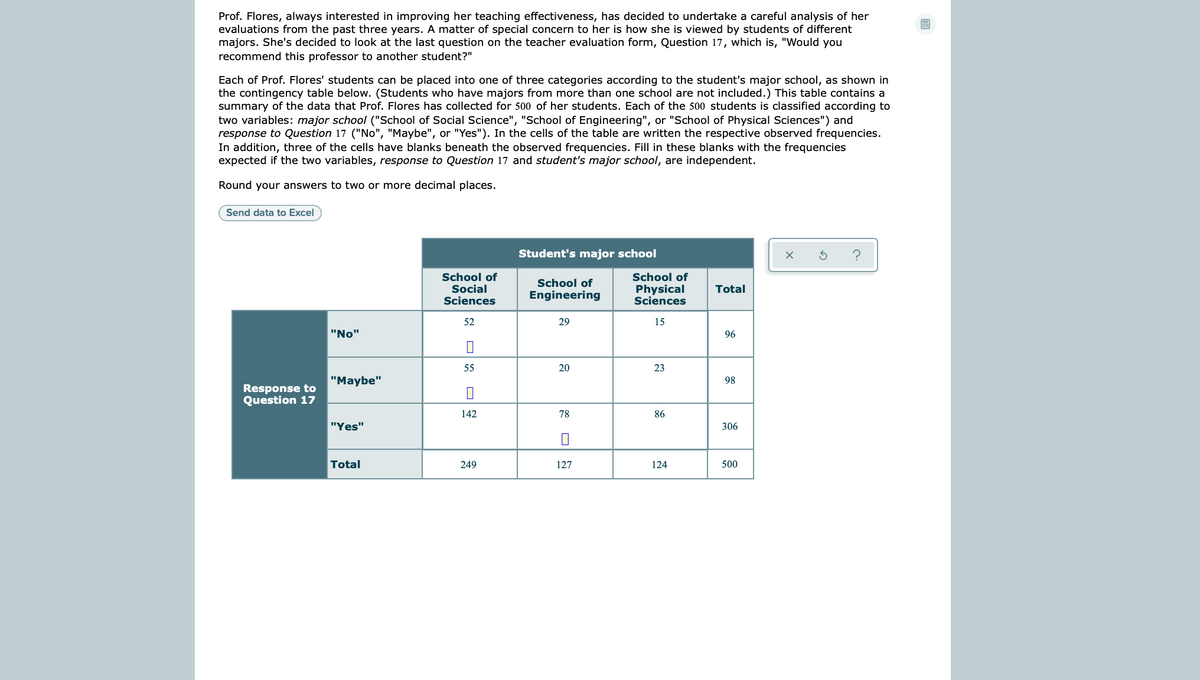
Transcribed Image Text:Prof. Flores, always interested in improving her teaching effectiveness, has decided to undertake a careful analysis of her
evaluations from the past three years. A matter of special concern to her is how she is viewed by students of different
majors. She's decided to look at the last question on the teacher evaluation form, Question 17, which is, "Would you
recommend this professor to another student?"
Each of Prof. Flores' students can be placed into one of three categories according to the student's major school, as shown in
the contingency table below. (Students who have majors from more than one school are not included.) This table contains a
summary of the data that Prof. Flores has collected for 500 of her students. Each of the 500 students is classified according to
two variables: major school ("School of Social Science", "School of Engineering", or "School of Physical Sciences") and
response to Question 17 ("No", "Maybe", or "Yes"). In the cells of the table are written the respective observed frequencies.
In addition, three of the cells have blanks beneath the observed frequencies. Fill in these blanks with the frequencies
expected if the two variables, response to Question 17 and student's major school, are independent.
Round your answers to two or more decimal places.
Send data to Excel
Student's major school
School of
Social
Sciences
School of
School of
Engineering
Physical
Sciences
Total
52
29
15
"No"
96
55
20
23
"Maybe"
98
Response to
Question 17
142
78
86
"Yes"
306
Total
249
127
124
500
Expert Solution
This question has been solved!
Explore an expertly crafted, step-by-step solution for a thorough understanding of key concepts.

This is a popular solution!

Trending now
This is a popular solution!

Step by step
Solved in 2 steps

Recommended textbooks for you
MATLAB: An Introduction with Applications
Statistics
ISBN:
9781119256830
Author:
Amos Gilat
Publisher:
John Wiley & Sons Inc

Probability and Statistics for Engineering and th…
Statistics
ISBN:
9781305251809
Author:
Jay L. Devore
Publisher:
Cengage Learning

Statistics for The Behavioral Sciences (MindTap C…
Statistics
ISBN:
9781305504912
Author:
Frederick J Gravetter, Larry B. Wallnau
Publisher:
Cengage Learning
MATLAB: An Introduction with Applications
Statistics
ISBN:
9781119256830
Author:
Amos Gilat
Publisher:
John Wiley & Sons Inc
Probability and Statistics for Engineering and th…
Statistics
ISBN:
9781305251809
Author:
Jay L. Devore
Publisher:
Cengage Learning
Statistics for The Behavioral Sciences (MindTap C…
Statistics
ISBN:
9781305504912
Author:
Frederick J Gravetter, Larry B. Wallnau
Publisher:
Cengage Learning

Elementary Statistics: Picturing the World (7th E…
Statistics
ISBN:
9780134683416
Author:
Ron Larson, Betsy Farber
Publisher:
PEARSON

The Basic Practice of Statistics
Statistics
ISBN:
9781319042578
Author:
David S. Moore, William I. Notz, Michael A. Fligner
Publisher:
W. H. Freeman

Introduction to the Practice of Statistics
Statistics
ISBN:
9781319013387
Author:
David S. Moore, George P. McCabe, Bruce A. Craig
Publisher:
W. H. Freeman