It is required to estimate the number of message buffers in use in the main memory of a computer system at Power Products Ltd. To do this, 20 programs were run and the number of message buffers in use were found to be 141 139 146 135 151 146 157 143 152 146 140 152 142 140 156 136 150 149 140 148 What is the skew using the R program developed in Example 2.2 of your book?
Q: The following are the data and consist of recorded values of age (months) by group: Active Group…
A: The following information has been given: Active Group Passive Group No-Exercise Group 8 Week…
Q: The table below contains the height in centimeters for10 sets of adult women twins. Calculate the…
A: The given table shows the height in centimeters for 10 sets of adult women twins.
Q: The following equations were estimated using the data in BWGHT: Tog(bwght) = 4.66 – .0044 cigs +…
A: Note: Hi there! Thank you for posting the question. As there are multiple sub-parts. according to…
Q: Need help! Will give thumbs up! Thank you. Data is typed below. CAR_PRICE GENDER AGE 3864.9…
A: b). The hypothesis that the gender will effect the sale price of the first car is given as-…
Q: 2. A real estate company surveyed the Middleton community of 26 homes and collected the following…
A: a. What are the minimum and maximum values of the value of house of the people? First, enter this…
Q: The manager of a fleet of automobiles is testing two brands of radial tires. He assigns one tire of…
A: Given : Brand 1 Brand 2 34900 36700 45500 47200 37100 37700 32000 31400 48900 47800…
Q: The following data give the percentage of women working in five companies in the retail and trade…
A: As per our guidelines, we are allowed to answer three sub-parts only. Thanks Given Data : X = %…
Q: What is the relationship between Za and Zb? b
A:
Q: The dola below represent the number of laptops. lisled. Sad By a lool Computer slore for the Years…
A: The time series is used to display the value of a variable with respect to time. It is generated by…
Q: the income (000) of two villages are given below: Village 1 50 80 70 60 78 123 30 47 41…
A: Given the income (000) of two villages as Village 1 50 80 70 60 78 123 30 47 41 Village 2 25 35…
Q: The following data shows the cost of electricity during July 2015 for a random sample of 50…
A: The data is represented as this below table: 96 171 202 178 147 102 153 197 127…
Q: The UWI Open Campus has commissioned a study to determine how student will perform in ECON3080 based…
A: The UWI Open Campus has commissioned a study to determine how student will perform in ECON3080 based…
Q: Which of the following is a benefit of a within-groups design over a between-groups design?
A: Given,, A multiple choice question: To find, which of the following is a benefit of a within…
Q: The table below gives the number of non-stop flights from city to city. City 1 City 2 City 3 City 4…
A: Given: For City 1. To go from City 1 to city 2, there are 3 non-stop flights. Similarly for…
Q: Find the computational value of the sign test using the data below Xi X ortalama 4 4 7 4 4.
A: A sign test is used to test whether there is significant difference between the population medians…
Q: Compute p(3), where pe Pol,(R) is the interpolation polynomial to the data p(1) = 1, (1) = 4. p(2) =…
A:
Q: Boy 84 72 73 41 85 91 72 67 58 74 54 62 71 48 91 Girl 82 65 77 39 71 87 80…
A: First we will calculate the mean and standard deviation for both the samples Boy 84 72…
Q: A survey of 400 college seniors resulted in the following crosstabulation regarding their…
A: Cross tabulation is a method of tabulating multiple variable in a single column. The cross…
Q: Calculate P(XX | sprinter) Is genotype independent of group? Justify your answer with an appropriate…
A: Here given, Contingency table for gene type and group
Q: Use a stem and leaf to display the data. 40 40 44 48 35 40 36 53 32 36 40 35 30 21 40 36 40 36 40 33…
A: The given data is : 40 40 44 48 35 40 36 53 32 36 40 35 30 21 40 36 40 36 40 33 40 32 38 29
Q: The after information speak to the running occasions of movies delivered by 2 film organizations:…
A: Any assumption about the parameter or probability function is known as hypothesis testing. Given…
Q: Do running times of American movies differ somehow from running times of French movies? A researcher…
A:
Q: The director of a local Tourism Authority would like to know whether a family’s annual expenditure…
A: calculation procedure for correlationsum of (x) = ∑x = 520.4sum of (y) = ∑y = 48sum of (x^2)= ∑x^2 =…
Q: A random sample of 40 PGA golfers was taken. The dataset is in the file PGAdriver.xls. A researcher…
A: Note: Hi there! Thank you for posting the question. As your question has more than 3 parts, we have…
Q: In Sperling's experiment, people were shown a 3 x 4 array of letters for 50 milliseconds. Regardless…
A:
Q: The manager of specialty outdoor store has gathered the following data concerning sales (in hundreds…
A: “Since you have asked multiple questions, we will solve the first question for you. If you want any…
Q: Construct a scatterplot for the given data. |-6|7| 8| 7| 12 |10|6 |-2 | 1 7) y| 2 9 12 10 11| 86 22…
A: To construct scatter diagram for the given data
Q: HOT COLD TOTAL SMALL 64 81 145 MEDIUM 72 70 142 LARGE 46 32 78 TOTAL 182 183 365 The two-way table…
A: Percentage
Q: On average, the data are greater in Set A and are more spread out in Set A On average, the data are…
A: Mean for set A = 28.2 Mean for set B = 25.9
Q: The exercise involving data in this and subsequent sections were designed to be solved using Excel.…
A:
Q: The following data give the percentage of women working in five companies in the retail and trade…
A: Hi, we are supposed to answer three subparts at a time. Since you have not mentioned which subpart…
Q: The following data give the percentage of women working in five companies in the retail and trade…
A: (C) Many different straight lines can be drawn to provide a linear approximation of relationship…
Q: n order to perform and ANOVA on the data to humber of all correct answer choices in nume
A: Assumptions in ANOVA test: 1)The variance between the 3 groups must be equal. 2) The data in each…
Q: D. Construct a scatterpiot for the folowing data and use it to comment on between the varables. the…
A: (1) Scatterplot of given data will be: Form: It is a linear positive regression.
Q: With a view to study whether the working condition in a factory had any influence on the frequency…
A: The objective is to calculate COEFFICIENT OF ASSOCIATION of given data.
Q: Consider the following data on domain [-1,1] x -1 -1/2 0 1/2 y 1 -1/2 1 5/2 Need help to rescale…
A: We are going to limit our dataset such that x is between range 0 to 2π Hence, points with x less…
Q: A set of data is found to have a u = 8 and a o = 3. What is o for this data set? Suppose each data…
A: Given that σ=3That means σ2=32=9.
Q: Suppose a doctor is monitoring cancer cells in a patient in order to initiate curative treatment…
A: the domain is {0,2,4,6,8,10,12,14,16,18,20} The range is…
Q: Calculate the coefficient of skewness for the data referring to 50 students. 173.5 171.4 178.2…
A: We can calculate skewness by using quartiles. Q1 is first quartile= (n+1)/4th term Median = (n/2th…
Q: The following data show the number of hurricanes to directly strike the mainland U.S. each decade. A…
A: Excel Procedure: Enter Number of major hurricanes and total number of hurricanes data in…
Q: 2. Find the least linear fit to the following data: 123 55 -2 -3 -3
A: The equation of line is an algebraic form of representing the set of points, which together form a…
Q: Use the data in the given table to fill in the missing coefficients. Round your answers to 3 decimal…
A: The linear regression equation is y = ax + b.
Q: A store manager counts the number of customers who make a purchase in his store each day. The data…
A: Introduction: To solve the problem, first arrange the data in an ascending order as follows: 7, 7,…
Q: 1la With the aid of simple diagrams, explain the types of skewness. b Calculate the skewness for the…
A: 11 (a) Skewness Skewness is an asymmetry or distortion in a collection of data that deviates from…
Q: The following data are stored in the variable called "data": 2 3 4 7 1 1 0 9 4 2 3 1 Write the…
A: Given, then
Q: The following table shows the liking of three colors, pink, white, and blue in a sample of 200 Males…
A: Given: Level of significance = 0.05 Colors Male Female Total Pink 20 40 60 white 40 20 60…
Q: A group of 2000 individuals from 3 different cities were asked whether they owned a foreign or a…
A: Solution: The Expected frequency table Type of car Detroit Atlanta Denver Total Domestic…
Q: Which player had the higher batting average in both 1995 and 1996? Compute the batting average for…
A: a) Justice has a higher batting average in both 1995 and 1996. b) The batting average for the…
Q: The following table gives the annual revenue for two different companies (in billions of dollars)…
A:
need help with following
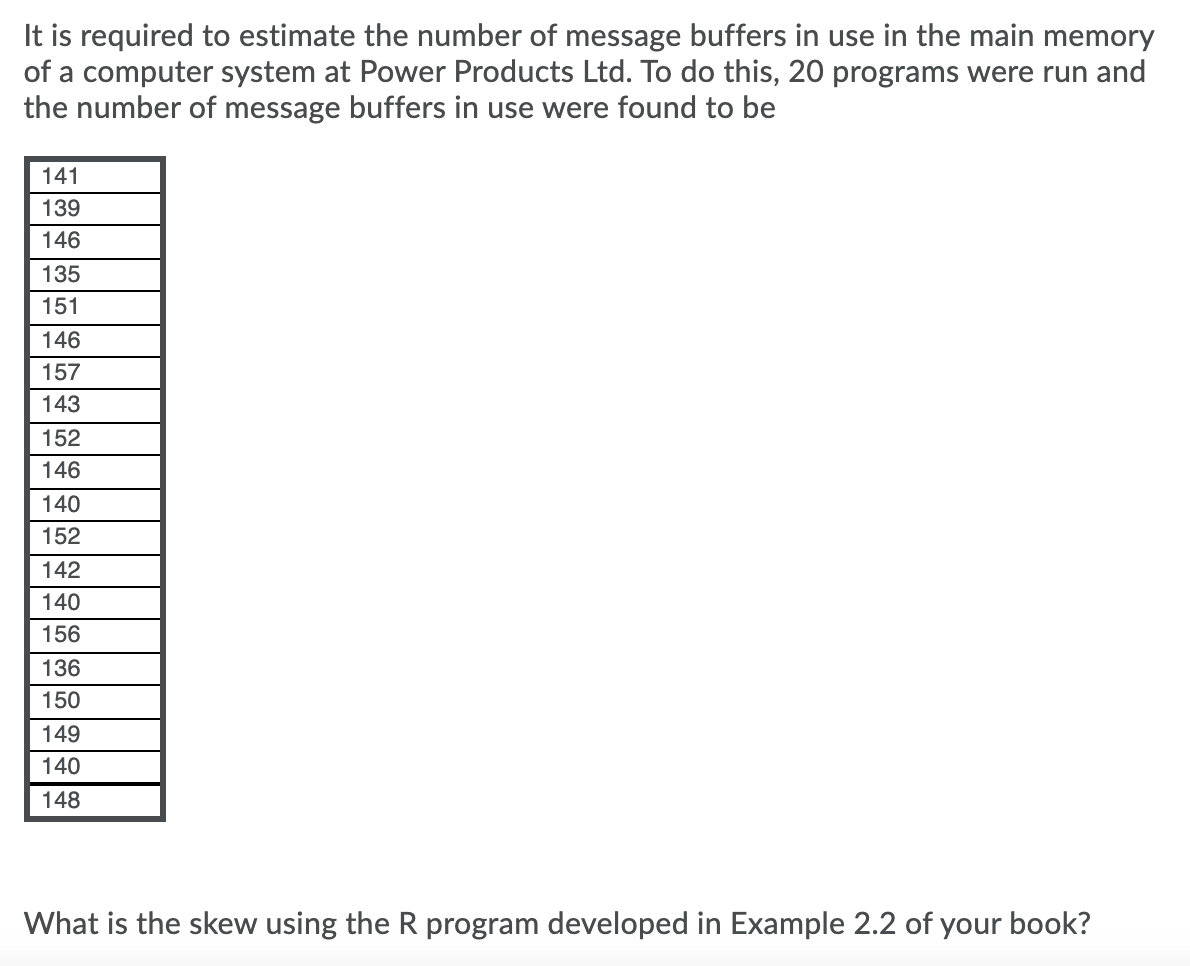
Trending now
This is a popular solution!
Step by step
Solved in 5 steps with 5 images
- A manufacturing company that produces laminate for countertops is interested in studying the relationship between the number of hours of training that an employee receives and the number of defects per countertop produced. Ten employees are randomly selected. The number of hours of training each employee has received is recorded and the number of defects on the most recent countertop produced is determined. The results are as follows. Hours of Training Defects per Countertop 1 5 4 1 7 0 3 3 2 5 2 4 5 1 5 2 1 8 6 2 Copy Data The estimated regression line and the standard error are given. Defects per Countertop=6.717822−1.004950(Hours of Training)se=1.229787se=1.229787 Suppose a new employee has had 5 hours of training. What would be the 90% prediction interval for the number of defects per countertop? Round your answer to two decimal places.Two varieties of lettuce were grown for 16 days in acontrolled environment. The following table shows the totaldry weight (in grams) of the leaves of nine plants of thevariety “Salad Bowl” and six plants of the variety “Bibb.” Compute the standard error of (Y1 - Y2) for these data.A research center claims that that 31% of adults in a certain country would travel into space on a commercial flight if they could afford it. In a random sample of 1200 adults in that country, 33% say that would travel into space on a commercial flight if they could afford it. At alpa= 0.05, isthere enough evidence to reject the research centers claim complete parts a through d below
- It has been noted that the amount of time people spend shopping in supermarkets incountry X has decreased due to the discovery of a new strain of Covid19. Based onthis realization,the manager of Power Supermarket decided to collect data for thelength of time people spend in his supermarket during a one week period. He is aimingto use the data to help him decide if the supermarket should be converted to a virtualsupermarket/a delivery based one.a. Use the information below to construct two frequency polygons.b. Do you think that Power Supermarket should close their doors?Explain your answer.*Assume that a person who spends more time in a supermarket buys a lot of goods anda person who spends a short time in a supermarket,buys few goods Beforethepandemic: Time Frequency1-5 506-10 2511-15 2216-20 8021-25 6026-30 4531-35 3 After the pandemic:Time Frequency1-5…A certain company produces fidget spinners with ball bearings made of either plastic or metal. Under standard testing conditions, fidget spinners from this company with plastic bearings spin for an average of 2.7 minutes, while those from this company with metal bearings spin for an average of 4.2 minutes. A random sample of three fidget spinners with plastic bearings is selected from company stock, and each is spun one time under the same standard conditions; let x¯1x¯1 represent the average spinning time for these three spinners. A random sample of seven fidget spinners with metal bearings is selected from company stock, and each is likewise spun one time under standard conditions; let x¯2x¯2 represent the average spinning time for these seven spinners. What is the mean μ(x¯1−x¯2)μ(x¯1−x¯2) of the sampling distribution of the difference in sample means x¯1−x¯2x¯1−x¯2 ? 3(2.7)−7(4.2)=−21.33(2.7)−7(4.2)=−21.3 A 3−7=−43−7=−4 B 2.7−4.2=−1.52.7−4.2=−1.5 C…The UWI Open Campus has commissioned a study to determine how student will perform in ECON3080 based on the hours of studying each semester. Students are separated by gender and the results of the study are given below: Males Females Hours Studying ECON3080 Grade Hours Studying ECON3080 Grade 377 92 182 51 280 100 99 41 187 99 44 38 225 62 387 90 157 91 200 75 280 99 331 48 80 32 263 78 374 88 377 93 141 59 297 49 385 72 229 88 238 30 254 80 105 94 347 80 180 53 119 55 288 48 142 67 241 96 293 45 72 57 318 36 314 82 319 94 196 81 60 60 209 79 319 42 306 79 184 81 167 51 193 56 380 44 239 34 389 88 144 49 122 49 97 100 354 76 337 33 327 94 330 78 181 70 157 57 349 66 262 43 117 35…