In an article in Accounting and Business Research, Beattie and Jones investigate the use and abuse of graphic presentations in the annual reports of United Kingdom firms. The authors found that 65 percent of the sampled companies graph at least one key financial variable, but that 30 percent of the graphics are materially distorted (nonzero vertical axis, exaggerated trend, or the like). Results for U.S. firms have been found to be similar. (a) Suppose that in a random sample of 451 graphics from the annual reports of United Kingdom firms, 142 of the graphics are found to be distorted. Find a point estimate of and a 95 percent confidence interval for the proportion of all U.K. annual report graphics that are distorted. (Round your answers to 4 decimal places.) Point estimate The 95 percent confidence interval is (b) Based on this interval, can we be 95 percent confident that more than 25 percent of all graphics appearing in the annual reports of U.K. firms are distorted? Does this suggest that auditors should understand proper graphing methods? Can we be 95 percent confident that more than 25 percent are distorted? Does this suggest that auditors should understand proper graphing methods?
In an article in Accounting and Business Research, Beattie and Jones investigate the use and abuse of graphic presentations in the annual reports of United Kingdom firms. The authors found that 65 percent of the sampled companies graph at least one key financial variable, but that 30 percent of the graphics are materially distorted (nonzero vertical axis, exaggerated trend, or the like). Results for U.S. firms have been found to be similar. (a) Suppose that in a random sample of 451 graphics from the annual reports of United Kingdom firms, 142 of the graphics are found to be distorted. Find a point estimate of and a 95 percent confidence interval for the proportion of all U.K. annual report graphics that are distorted. (Round your answers to 4 decimal places.) Point estimate The 95 percent confidence interval is (b) Based on this interval, can we be 95 percent confident that more than 25 percent of all graphics appearing in the annual reports of U.K. firms are distorted? Does this suggest that auditors should understand proper graphing methods? Can we be 95 percent confident that more than 25 percent are distorted? Does this suggest that auditors should understand proper graphing methods?

MATLAB: An Introduction with Applications
6th Edition
ISBN:9781119256830
Author:Amos Gilat
Publisher:Amos Gilat
Chapter1: Starting With Matlab
Section: Chapter Questions
Problem 1P

Related questions

Question
100%
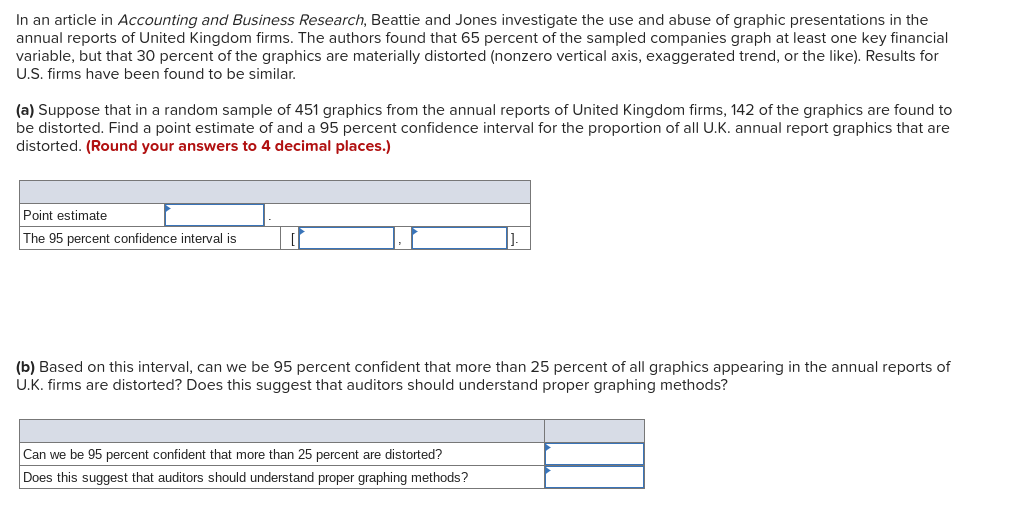
Transcribed Image Text:In an article in Accounting and Business Research, Beattie and Jones investigate the use and abuse of graphic presentations in the
annual reports of United Kingdom firms. The authors found that 65 percent of the sampled companies graph at least one key financial
variable, but that 30 percent of the graphics are materially distorted (nonzero vertical axis, exaggerated trend, or the like). Results for
U.S. firms have been found to be similar.
(a) Suppose that in a random sample of 451 graphics from the annual reports of United Kingdom firms, 142 of the graphics are found to
be distorted. Find a point estimate of and a 95 percent confidence interval for the proportion of all U.K. annual report graphics that are
distorted. (Round your answers to 4 decimal places.)
Point estimate
The 95 percent confidence interval is
(b) Based on this interval, can we be 95 percent confident that more than 25 percent of all graphics appearing in the annual reports of
U.K. firms are distorted? Does this suggest that auditors should understand proper graphing methods?
Can we be 95 percent confident that more than 25 percent are distorted?
Does this suggest that auditors should understand proper graphing methods?
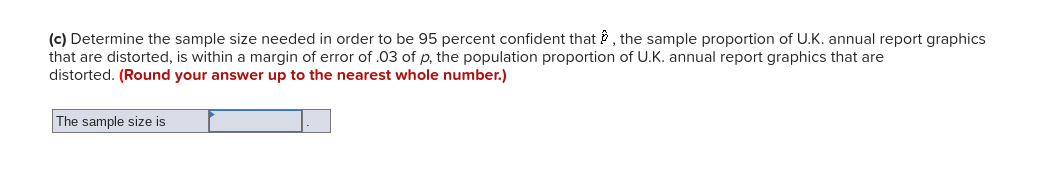
Transcribed Image Text:(c) Determine the sample size needed in order to be 95 percent confident that P, the sample proportion of U.K. annual report graphics
that are distorted, is within a margin of error of .03 of p, the population proportion of U.K. annual report graphics that are
distorted. (Round your answer up to the nearest whole number.)
The sample size is
Expert Solution
This question has been solved!
Explore an expertly crafted, step-by-step solution for a thorough understanding of key concepts.

This is a popular solution!

Trending now
This is a popular solution!

Step by step
Solved in 3 steps

Knowledge Booster


Learn more about
Need a deep-dive on the concept behind this application? Look no further. Learn more about this topic, statistics and related others by exploring similar questions and additional content below.Recommended textbooks for you
MATLAB: An Introduction with Applications
Statistics
ISBN:
9781119256830
Author:
Amos Gilat
Publisher:
John Wiley & Sons Inc

Probability and Statistics for Engineering and th…
Statistics
ISBN:
9781305251809
Author:
Jay L. Devore
Publisher:
Cengage Learning

Statistics for The Behavioral Sciences (MindTap C…
Statistics
ISBN:
9781305504912
Author:
Frederick J Gravetter, Larry B. Wallnau
Publisher:
Cengage Learning
MATLAB: An Introduction with Applications
Statistics
ISBN:
9781119256830
Author:
Amos Gilat
Publisher:
John Wiley & Sons Inc
Probability and Statistics for Engineering and th…
Statistics
ISBN:
9781305251809
Author:
Jay L. Devore
Publisher:
Cengage Learning
Statistics for The Behavioral Sciences (MindTap C…
Statistics
ISBN:
9781305504912
Author:
Frederick J Gravetter, Larry B. Wallnau
Publisher:
Cengage Learning

Elementary Statistics: Picturing the World (7th E…
Statistics
ISBN:
9780134683416
Author:
Ron Larson, Betsy Farber
Publisher:
PEARSON

The Basic Practice of Statistics
Statistics
ISBN:
9781319042578
Author:
David S. Moore, William I. Notz, Michael A. Fligner
Publisher:
W. H. Freeman

Introduction to the Practice of Statistics
Statistics
ISBN:
9781319013387
Author:
David S. Moore, George P. McCabe, Bruce A. Craig
Publisher:
W. H. Freeman