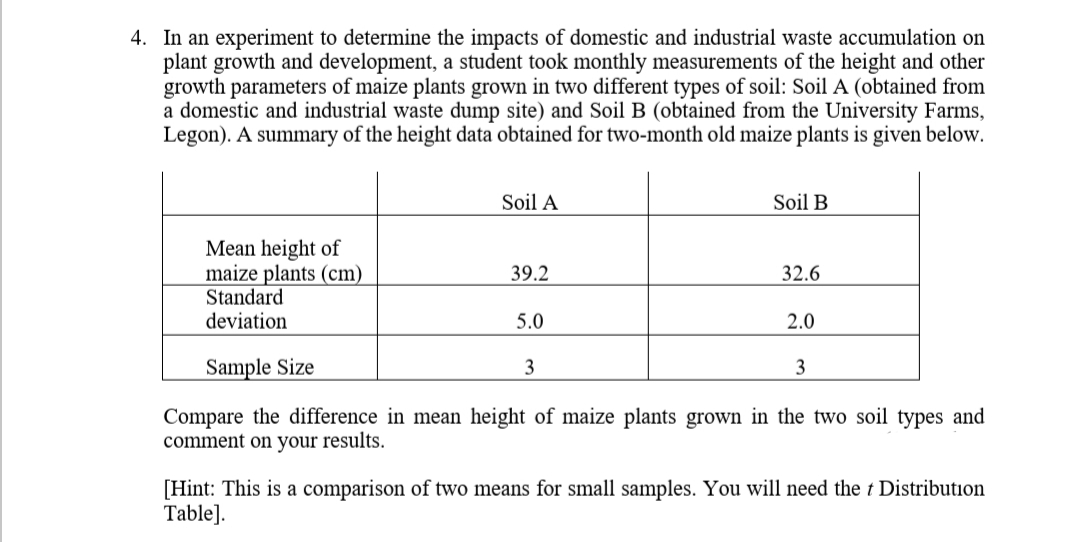
In an experiment to determine the impacts of domestic and industrial waste accumulation on plant growth and development, a student took monthly measurements of the height and other growth parameters of maize plants grown in two different types of soil: Soil A (obtained from a domestic and industrial waste dump site) and Soil B (obtained from the University Farms, Legon). A summary of the height data obtained for two-month old maize plants is given below. Soil A Soil B Mean height of maize plants (cm) 39.2 32.6 Standard
Q: Determine the minimum data value, the quartiles, and the maximum data value for the PHT-34 and…
A: The quartiles Q1 Q2 and Q3 are medians of the data where Q2 is the median of the data and Q1 is the…
Q: TABLE 10-3 A real estate company is interested in testing whether the mean time that families in…
A: Critical value is -2.33 at left tailed test
Q: Consider the following measurements of blood hemoglobin concentrations (in g/dL) from three human…
A: Answer: One-way ANOVA is be performed here Null hypothesis: There is no difference between the blood…
Q: Consider the following examples of populations, together with the variable/characteristic measured…
A: Given: Population: All undergraduate students enrolled at SLU for the 1st SemesterVariable:…
Q: Wauchope and McDowell (1984) studied the effect of the amount of extractable iron, the amount of…
A:
Q: Find the first quartile for this data set.
A:
Q: As part of a pilot study aimed at determining the daily consumption of water (in litres) across…
A:
Q: The spike stature of the plants grown from the seeds of the porcine separates (Dactylis glomerata L)…
A: Given nX=11, nY=10 X (x-x__)2 Y (y-y__)2 5 1 12 3.61 6 0 9 1.21 8 4 11 0.81 7 1 9 1.21…
Q: Consider the following measurements of blood hemoglobin concentrations (in g/dL) from three human…
A: Test hypotheses: There are 3 populations. Denote the true mean of each of the 3 populations as μ1,…
Q: The owner of Showtime Movie Theaters, Inc., would like to predict weekly gross revenue as a function…
A: The data is given as: Weekly Gross (y) Television AD (x1) Newspaper AD (x2) 96 5 1.5 90 2 2…
Q: An article in Plant Disease, "Effect of Nitrogen and Potassium Fertilizer Rates on Severity of…
A: Given:
Q: In a study conducted recently, the body weight of youth wresting team in Mongolia are found to be as…
A: For the given data, Ogive Curve can be constructed using Excel and the procedure is as follows:…
Q: Managers of an outdoor coffee stand in Coast City are examining the relationship between (hot)…
A: Given: Slope of the regression line= -10.42 The given data is: Temperature, x Sales,y 57.6…
Q: Samples of head breadths were obtained by measuring skulls of Egyptian males from three different…
A: (a) Define the parameters. The parameters are defined below as follows: From the information,…
Q: An article in Plant Disease, "Effect of Nitrogen and Potassium Fertilizer Rates on Severity of…
A:
Q: Consider the following measurements of blood hemoglobin concentrations (in g/dL) from three human…
A: Given : The provided measurements of blood hemoglobin concentrations (in g/dL) from three human…
Q: Which of the following is NOT one of IBM's big data characteristics? Variety Velocity Venn diagram…
A: Big data is the data set, which have huge volume that is beyond to perform manual analysis. Such…
Q: The data was obtained in a study on the number of absences in the day and the final gra of seven…
A: d) From the given output, the correlation between number of absences and final grade is -0.944. That…
Q: An experiment is conducted to determine the time evolution of the mean increases in growth produced…
A:
Q: A professor at the University of Iowa was interested in evaluating whether domestic dispute calls…
A:
Q: An article reports the following values for soil heat flux of eight plots covered with coal dust.…
A: The provided data set is:
Q: Blood cocaine concentration (mg/L) was determinedboth for a sample of individuals who had died…
A: a.
Q: The National Association of Home Builders provided data on the cost of the most popular home…
A: Given data Kitchen Master bedroom Kitchen Master Bedroom 25.2 18.0…
Q: Consider the following examples of populations, together with the variable/characteristic measured…
A: Population: Accountability reports by State Universities and Colleges and Government Owned and…
Q: A data set includes weights of garbage discarded in one week from 02 different households. The…
A:
Q: Interpret the results presented in the following table. Table 2: Descriptive Analysis Cronbach Mean…
A: Skewness: If the value of skewness is equal to zero then the distribution is normal and symmetric.…
Q: A wholesaler sets a national distribution center to serve the five regions in the country: Hawaii,…
A: The country is composed of five regions: Hawaii, East, West, North, South Let X denotes the weekly…
Q: A tuatara is a reptile that is endemic to New Zealand and the sole surviving species of its order…
A: Solution is given below.
Q: An article reported data from a study in which both a baseline gasoline mixture and a reformulated…
A: Scatter plot: Excel Procedure: Enter the Age and Baseline in Excel>Select the Age and…
Q: A sample of a certain population was investigated in relation to salt consumption daily, obtaining…
A: Pop Cons(g) A 10 B 13 C 17 D 9 E 8 F 11 G 13 H 7
Q: The following table cross classifies pregnant women in the study by their body mass index at 16…
A: According to the provided information, bmi <30 bmi 30-34.9…
Q: Exposure to microbial products, especially endotoxin, may have an impact on vulnerability to…
A: Mean is calculate by adding all the observation in the sample divide by the sample size. It provide…
Q: is computed from a sample and is used to estimate a population parameter.
A: 2. Parameter: The population parameter is the number that describes the population. Also, the…
Q: A group of public health nutrition students determined whether mung bean (Vigna radiata) can support…
A:
Q: QUESTION 2 PART A- For the three populations, what is the value of MSgroups in the ANOVA table?…
A: Solution:
Q: Exposure to microbial products, especially endotoxin, may have an impact on vulnerability to…
A:
Q: professor at the University of Iowa was interested in evaluating whether domestic dispute calls were…
A: Solution To test the hypothesis we will use Chi square distribution.
Q: QUESTION 4 A steel manufacturing company wishes to compare the strength of the wires produced by an…
A:
Q: Histogram: fines paid by drivers 12 10 4. 1 2 3 More Number of fines paid a year by a driver Compute…
A:
Q: To test whether the mean time needed to mix a batch of material is the same for machines produced by…
A: For the given data Perform Anova single factor
Q: Suppose the National Transportation Safety Board (NTSB) wants to examine the safety of compact cars,…
A: Null and Alternative hypothesis : The null hypothesis could be a claim that's ofttimes created…
Q: On a recent evening, a police crackdown on prostitution solicitation resulted in 19 arrests. The…
A: a. The ascending order of the given age data is: 17, 18, 19, 20, 21, 21, 22, 24, 24, 24, 25, 26, 30,…
Q: A local veterinarian uses Z-scores to determine if newborn puppies of certain breeds are severely…
A:
Q: The weights (in pounds) of 6 vehicles and the variability of their braking distances (in feet) when…
A: Now to check is there significant linear correlation between weight of vehicle and variability in…
Q: Consider the following measurements of blood hemoglobin concentrations (in g/dL) from three human…
A: Test hypotheses: There are 3 populations. Denote the true mean of each of the 3 populations as μ1,…
Q: Suppose an architectural firm specializing in the structural restoration and renovation of historic…
A: From the given information, μ=65σ=12.6n=81M=67.3 Type II Error: The type II error occurs if “fail to…
Q: A sociologist was hired by a large city hospital to investigate the relationship between the number…
A: Correct option is 2nd.
Q: The National Association of Home Builders provided data on the cost of the most popular home…
A:
Step by step
Solved in 3 steps with 5 images
- Here is a dataset containing plant growth measurements of plants grown in solutions of commonly-found chemicals in roadway runoff.Phragmites australis, a fast-growing non-native grass common to roadsides and disturbed wetlands of Tidewater Virginia, was grown in a greenhouse and watered with either: Distilled water (control); A weak petroleum solution (representing standard roadway runoff); Sodium chloride solution; Magnesium chloride solution; De-icing brine (50% sodium chloride and 50% magnesium chloride).Twenty grass preparations were used for each solution, and total growth (in cm) was recorded after watering every other day for 40 days.-Perform the correct statistical test to determine the p-value.-Report your answer rounded to four decimal places.-You should use formulas, functions, and the Data Analysis ToolPak in MS Excel to avoid additive rounding errors. Here are some useful functions: =t.test(array1,array2,tails,type) Produces a p-value for any…An article reported data from a study in which both a baseline gasoline mixture and a reformulated gasoline were used. Consider the following observations on age (yr) and NOx emissions (g/kWh): Engine 1 2 3 4 5 6 7 8 9 10 Age 0 0 2 11 7 16 9 0 12 4 Baseline 1.74 4.38 4.04 1.23 5.30 0.58 3.35 3.44 0.73 1.23 Reformulated 1.85 5.93 5.52 2.67 6.54 0.76 4.94 4.87 0.69 1.39 Construct scatter plots of the baseline NOx emissions versus age. Construct scatter plots of the reformulated NOx emissions versus age. What appears to be the nature of the relationship between these two variables? As age increases, emissions also increase.As age increases, emissions decrease. There is no compelling relationship between the data.The Turbine Oil Oxidation Test (TOST) and the Rotating Bomb Oxidation Test (RBOT) are two different procedures for evaluating the oxidation stability of steam turbine oils. An article reported the accompanying observations on x = TOST time (hr) and y = RBOT time (min) for 12 oil specimens. TOST 4200 3600 3750 3650 4050 2770 RBOT 370 345 375 315 350 205 TOST 4870 4525 3450 2700 3750 3325 RBOT 400 380 285 220 345 290 (a) Calculate the value of the sample correlation coefficient. (Round your answer to four decimal places.) r = Carry out a test of hypotheses to decide whether RBOT Time and TOST time are linearly related. (Use ? = 0.05.) Calculate the test statistic and determine the P-value. (Round your test statistic to two decimal places and your P-value to three decimal places.) t = P-value =
- An article reported data from a study in which both a baseline gasoline mixture and a reformulated gasoline were used. Consider the following observations on age (yr) and NOx emissions (g/kWh): Engine 1 2 3 4 5 6 7 8 9 10 Age 0 0 2 11 7 16 9 0 12 4 Baseline 1.70 4.38 4.06 1.24 5.29 0.59 3.35 3.45 0.73 1.22 Reformulated 1.86 5.91 5.51 2.70 6.50 0.71 4.95 4.86 0.72 1.41 Construct scatter plots of the baseline NOx emissions versus age. What appears to be the nature of the relationship between these two variables? There is no compelling relationship between the data. As age increases, emissions also increase. As age increases, emissions decrease.Floyd Distributors, Inc., provides a variety of auto parts to small local garages. Floyd purchases parts from manufacturers according to the EOQ model and then ships the parts from a regional warehouse direct to its customers. For a particular type of muffler, Floyd's EOQ analysis recommends orders with Q* = 20 to satisfy an annual demand of 180 mufflers. Floyd's has 250 working days per year, and the lead time averages 15 days.Note: Use Appendix B to identify the areas for the standard normal distribution. What is the reorder point if Floyd assumes a constant demand rate? If required, round your answer up to the nearest whole number. r = fill in the blank 1 Suppose that an analysis of Floyd's muffler demand shows that the lead-time demand follows a normal probability distribution with µ = 12 and σ = 2.2. If Floyd's management can tolerate one stock-out per year, what is the revised reorder point? If required, round your answer up to the nearest whole number. r = fill in the blank…Suppose that, as part of a research methods class, Bailey was asked to write a summary of a research paper on the topic of the effects of oil contamination in soil on seed germination rates. Identify the explanatory and the response variables.
- Obtain the appropriate measure of dispersion for age and both income variables. DATA Subject Gender Marital Status Age Education Household Income Personal Income 1 F 1 30 0 70000.00 40000.00 2 F 0 40 0 32500.00 32500.00 3 M 1 45 0 42000.00 .0 4 M 1 23 0 50000.00 50000.00 5 M 0 50 0 4500.00 4500.00 6 F 0 65 1 40000.00 22000.00 7 F 1 33 1 12000.00 12000.00 8 F 0 20 2 56000.00 52000.00 9 F missing 30 3 17500.00 17500.00 10 M 1 Missing 4 44000.00 39000.00 11 M 2 58 1 missing missing 12 M 2 32 2 10000.00 10000.00 13 M 1 35 3 missing missing 14 F 2 23 4 100000.00 50000.00 15 F 2 34 1 64000.00 64000.00 16 M 1 26 2 Missing missing 17 M 1 36 3 missing missing 18 F 0 41 4 7500.00 5500.00 19…A study was conducted to assess the impact of nutrient enrichment on zooplankton densities in A & B Islands. An ecologist sampled populations of zooplankton in these two locations and observed the nutrient enrichment level was higher in A island when compared with the level in B island. It is predicted the zooplankton densities in A island will be greater than those found in B island.Exposure to microbial products, especially endotoxin,may have an impact on vulnerability to allergic diseases. The article “Dust Sampling Methods for Endotoxin—An Essential, But Underestimated Issue” (Indoor Air,2006: 20–27) considered various issues associated withdetermining endotoxin concentration. The following dataon concentration (EU/mg) in settled dust for one sampleof urban homes and another of farm homes was kindlysupplied by the authors of the cited article. U: 6.0 5.0 11.0 33.0 4.0 5.0 80.0 18.0 35.0 17.0 23.0F: 4.0 14.0 11.0 9.0 9.0 8.0 4.0 20.0 5.0 8.9 21.0 9.2 3.0 2.0 0.3 a. Determine the sample mean for each sample. Howdo they compare?b. Determine the sample median for each sample. Howdo they compare? Why is the median for the urbansample so different from the mean for that sample?c. Calculate the trimmed mean for each sample bydeleting the smallest and largest observation. Whatare the corresponding trimming percentages? Howdo the values of these…
- The authors of the article “Predictive Model for PittingCorrosion in Buried Oil and Gas Pipelines”(Corrosion, 2009: 332–342) provided the data on whichtheir investigation was based.a. Consider the following sample of 61 observations onmaximum pitting depth (mm) of pipeline specimensburied in clay loam soil. 0.41 0.41 0.41 0.41 0.43 0.43 0.43 0.48 0.480.58 0.79 0.79 0.81 0.81 0.81 0.91 0.94 0.941.02 1.04 1.04 1.17 1.17 1.17 1.17 1.17 1.171.17 1.19 1.19 1.27 1.40 1.40 1.59 1.59 1.601.68 1.91 1.96 1.96 1.96 2.10 2.21 2.31 2.462.49 2.57 2.74 3.10 3.18 3.30 3.58 3.58 4.154.75 5.33 7.65 7.70 8.13 10.41 13.44Construct a stem-and-leaf display in which the twolargest values are shown in a last row labeled HI.b. Refer back to (a), and create a histogram based oneight classes with 0 as the lower limit of the firstclass and class widths of .5, .5, .5, .5, 1, 2, 5, and 5,respectively.c. The accompanying comparative boxplot fromMinitab shows plots of pitting depth for four differenttypes of soils.…The spike stature of the plants grown from the seeds of the porcine separates (Dactylis glomerata L) collected from the University campus and İbradı Eynif pasture are given below. In this plant, compare whether there is a difference between regions in terms of spike height. Virgo Height (cm) Data obtained from plants collected from university campus 5 6 8 7 8 6 5 5 4 6 6 Data obtained from plants collected from Eynif pasture 12 9 11 9 9 11 9 10 11 10 Note: Your results interpretation according to two different possibilities (Do it separately, assuming that it is 0.07 and 0.04).Consider a cohort study to compare the mortality rate of myocardial infarction (MI) in men with sedentary work (exposed group) to men with physically active work (unexposed). If in the exposed, there were 36,000 person (man) years of observation and 126 deaths whereas the unexposed had 24,000 man-years of observation and 44 deaths. Compute the following a) Mortality rate in each cohort? b) What is the relative risk of dying, comparing these 2 groups? c) What is the attributable risk of sedentary work? d) What is the attributable benefit of physical activity? e) If we assume that MI is associated with the mortality in this cohort (causality), what proportion of the disease in the higher group is potentially preventable?