An article reported data from a study in which both a baseline gasoline mixture and a reformulated gasoline were used. Consider the following observations on age (yr) and NO, emissions (g/k Engine Age Baseline 2 4 6 7 8. 10 2 11 16 9 12 4 1.69 4.35 4.09 1.26 5.29 0.54 3.37 3.47 0.75 1.21 Reformulated 1.85 5.95 5.52 2.66 6.54 0.74 4.92 4.92 0.70 1.43 In USE SALT Construct scatter plots of the baseline NO, emissions versus age. NOX NO, 6. 6 5 5 4 4 • 3
An article reported data from a study in which both a baseline gasoline mixture and a reformulated gasoline were used. Consider the following observations on age (yr) and NO, emissions (g/k Engine Age Baseline 2 4 6 7 8. 10 2 11 16 9 12 4 1.69 4.35 4.09 1.26 5.29 0.54 3.37 3.47 0.75 1.21 Reformulated 1.85 5.95 5.52 2.66 6.54 0.74 4.92 4.92 0.70 1.43 In USE SALT Construct scatter plots of the baseline NO, emissions versus age. NOX NO, 6. 6 5 5 4 4 • 3

Glencoe Algebra 1, Student Edition, 9780079039897, 0079039898, 2018
18th Edition
ISBN:9780079039897
Author:Carter
Publisher:Carter
Chapter10: Statistics
Section10.6: Summarizing Categorical Data
Problem 31PPS

Related questions
Question
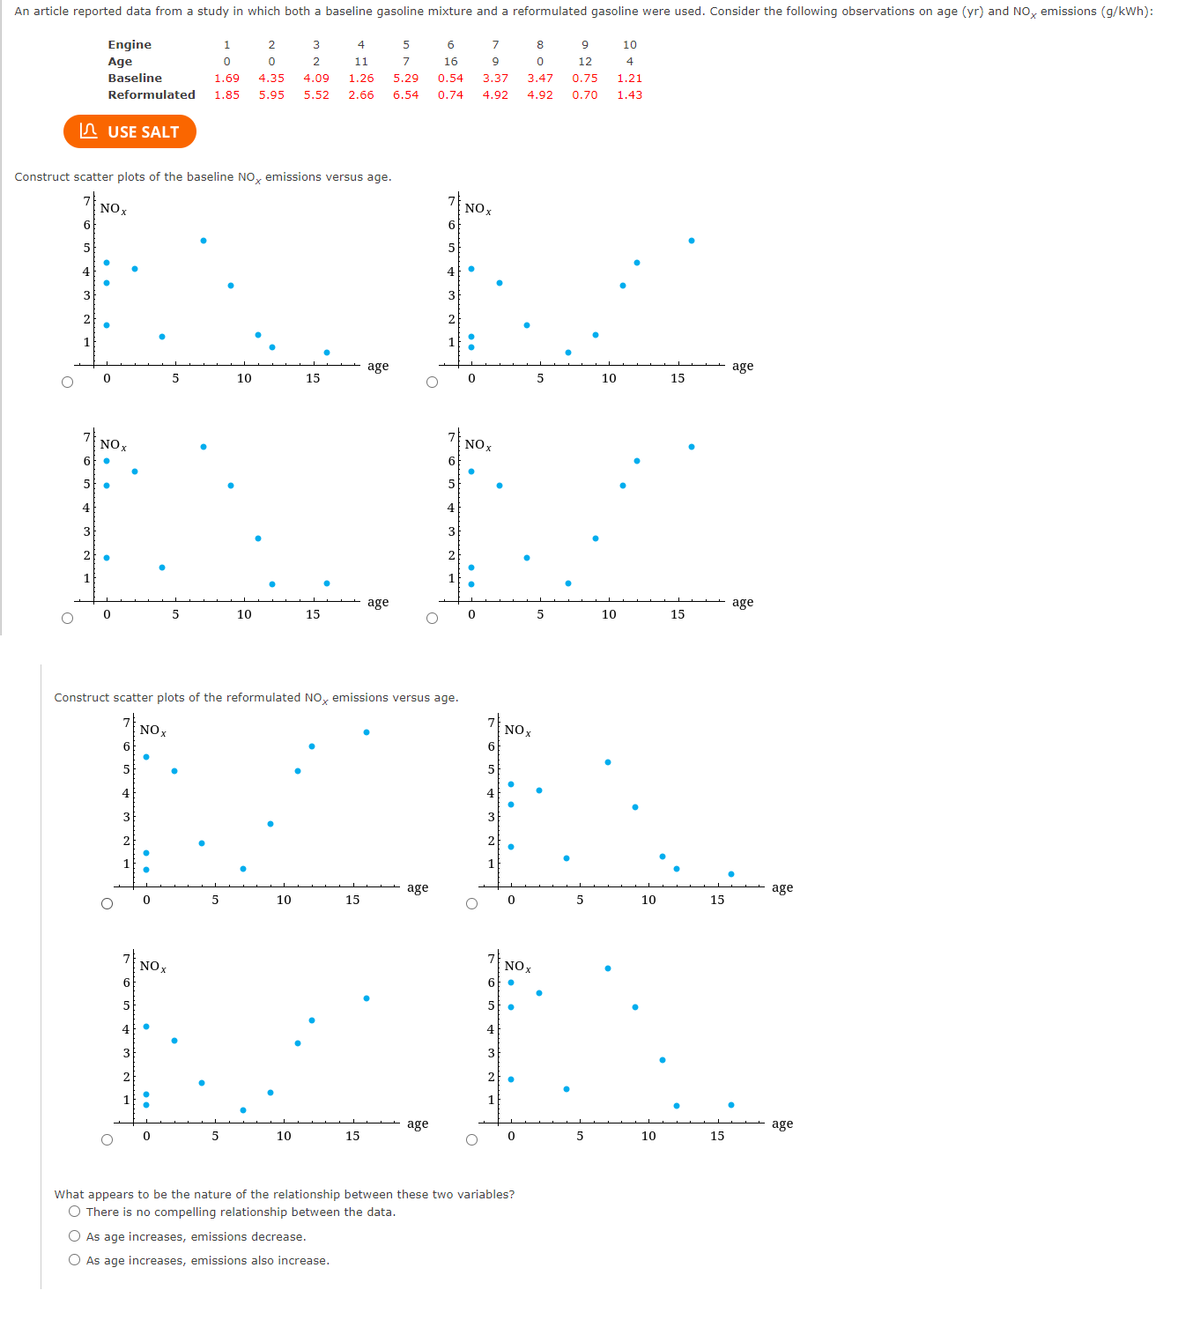
Transcribed Image Text:An article reported data from a study in which both a baseline gasoline mixture and a reformulated gasoline were used. Consider the following observations on age (yr) and NO, emissions (g/kWh):
Engine
1
3
4
7
8
10
Age
2
11
7
16
9.
12
4
Baseline
1.69
4.35
4.09
1.26
5.29
0.54
3.37
3.47
0.75
1.21
Reformulated
1.85
5.95
5.52
2.66
6.54
0.74
4.92
4.92
0.70
1.43
n USE SALT
Construct scatter plots of the baseline NO, emissions versus age.
NOX
NOX
6
3
3
2
1
1
age
age
10
15
5
10
15
NOX
NOX
6.
5
4
4
3
3
2
2
1
1
age
age
10
15
10
15
Construct scatter plots of the reformulated NO, emissions versus age.
NOx
NOX
6
6
4
4
3
3
2
1
1
age
age
10
15
5
10
15
NOX
NOX
6
6.
4
4
3
3
2
2
1
1
age
age
10
15
5
10
15
What appears to be the nature of the relationship between these two variables?
O There is no compelling relationship between the data.
O As age increases, emissions decrease.
O As age increases, emissions also increase.
Expert Solution
This question has been solved!
Explore an expertly crafted, step-by-step solution for a thorough understanding of key concepts.

This is a popular solution!

Trending now
This is a popular solution!

Step by step
Solved in 2 steps with 2 images

Recommended textbooks for you
Glencoe Algebra 1, Student Edition, 9780079039897…
Algebra
ISBN:
9780079039897
Author:
Carter
Publisher:
McGraw Hill
Glencoe Algebra 1, Student Edition, 9780079039897…
Algebra
ISBN:
9780079039897
Author:
Carter
Publisher:
McGraw Hill