The data was obtained in a study on the number of absences in the day and the final gra of seven randomly selected students from a statistics class. The data and output of IBM-SP software are shown below. Student A Number of absences 6 Final grade 82
The data was obtained in a study on the number of absences in the day and the final gra of seven randomly selected students from a statistics class. The data and output of IBM-SP software are shown below. Student A Number of absences 6 Final grade 82

MATLAB: An Introduction with Applications
6th Edition
ISBN:9781119256830
Author:Amos Gilat
Publisher:Amos Gilat
Chapter1: Starting With Matlab
Section: Chapter Questions
Problem 1P

Related questions
Question
Transcribed Image Text:QUESTION 3
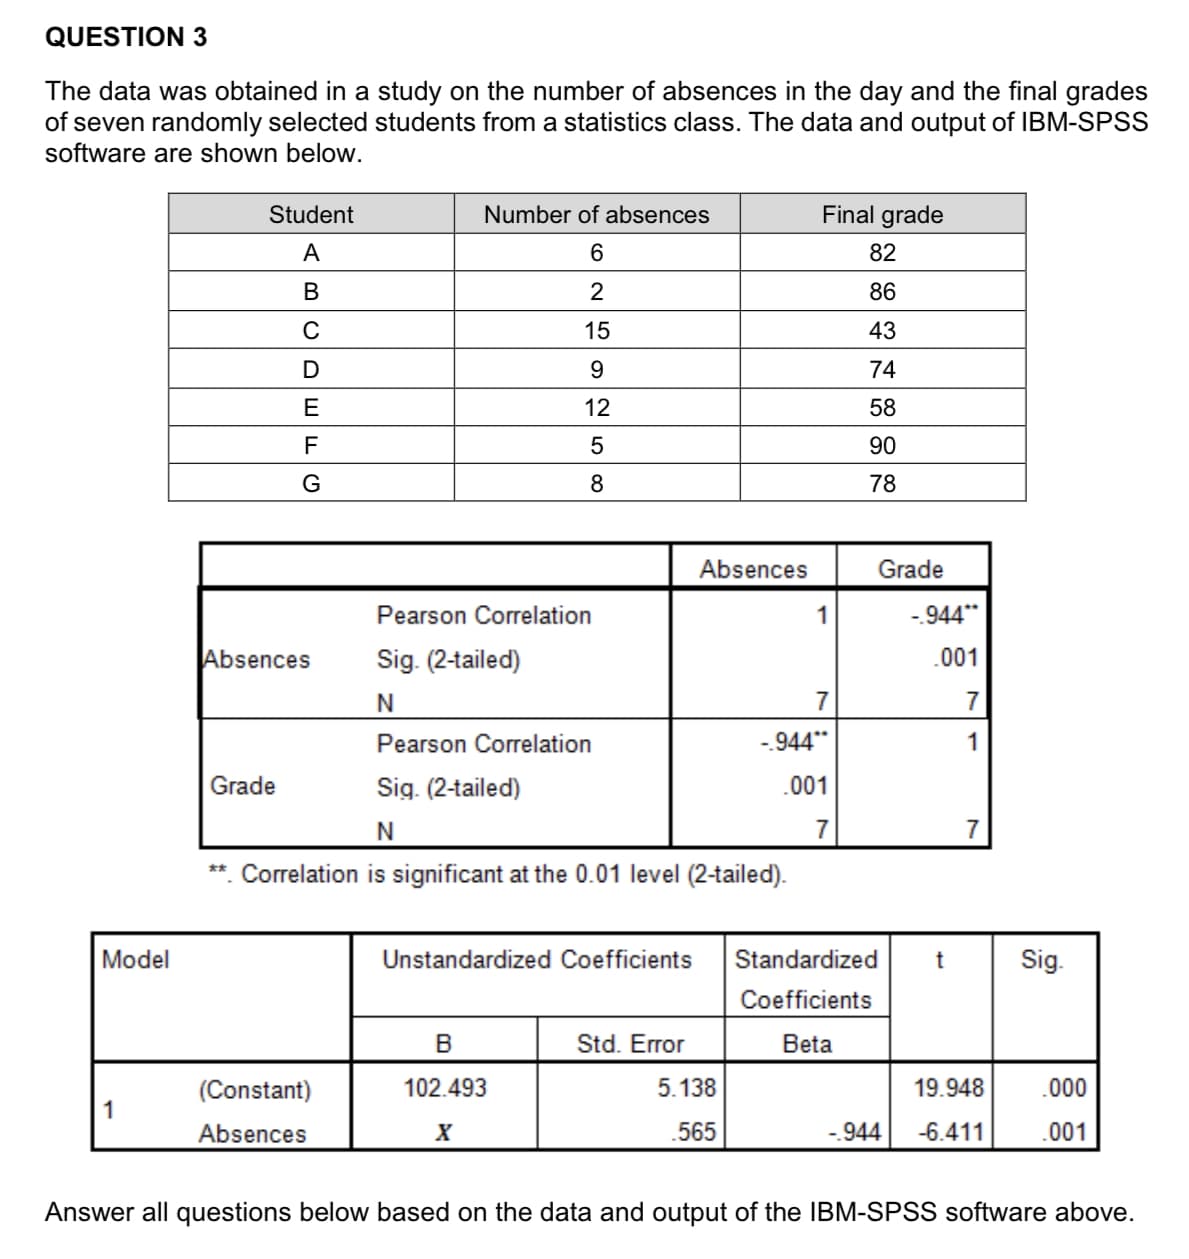
The data was obtained in a study on the number of absences in the day and the final grades
of seven randomly selected students from a statistics class. The data and output of IBM-SPSS
software are shown below.
Model
1
Student
A
B
C
D
E
F
G
Absences
Grade
Number of absences
6
2
15
9
12
5
8
(Constant)
Absences
Pearson Correlation
Sig. (2-tailed)
N
Pearson Correlation
Sig. (2-tailed)
N
**. Correlation is significant at the 0.01 level (2-tailed).
Unstandardized Coefficients
B
102.493
X
Absences
Std. Error
5.138
565
Final grade
82
86
43
74
58
90
78
1
7
-.944**
.001
7
Grade
Standardized
Coefficients
Beta
-.944
-.944**
.001
7
1
t
7
19.948
-6.411
Sig.
.000
.001
Answer all questions below based on the data and output of the IBM-SPSS software above.
Transcribed Image Text:d) Find the coefficient of determination and explain the value obtained.
e) Write down the linear regression model for this study.
f) Estimate the final grade if the number of absences is two weeks.
Expert Solution
This question has been solved!
Explore an expertly crafted, step-by-step solution for a thorough understanding of key concepts.

Step by step
Solved in 3 steps

Recommended textbooks for you
MATLAB: An Introduction with Applications
Statistics
ISBN:
9781119256830
Author:
Amos Gilat
Publisher:
John Wiley & Sons Inc

Probability and Statistics for Engineering and th…
Statistics
ISBN:
9781305251809
Author:
Jay L. Devore
Publisher:
Cengage Learning

Statistics for The Behavioral Sciences (MindTap C…
Statistics
ISBN:
9781305504912
Author:
Frederick J Gravetter, Larry B. Wallnau
Publisher:
Cengage Learning
MATLAB: An Introduction with Applications
Statistics
ISBN:
9781119256830
Author:
Amos Gilat
Publisher:
John Wiley & Sons Inc
Probability and Statistics for Engineering and th…
Statistics
ISBN:
9781305251809
Author:
Jay L. Devore
Publisher:
Cengage Learning
Statistics for The Behavioral Sciences (MindTap C…
Statistics
ISBN:
9781305504912
Author:
Frederick J Gravetter, Larry B. Wallnau
Publisher:
Cengage Learning

Elementary Statistics: Picturing the World (7th E…
Statistics
ISBN:
9780134683416
Author:
Ron Larson, Betsy Farber
Publisher:
PEARSON

The Basic Practice of Statistics
Statistics
ISBN:
9781319042578
Author:
David S. Moore, William I. Notz, Michael A. Fligner
Publisher:
W. H. Freeman

Introduction to the Practice of Statistics
Statistics
ISBN:
9781319013387
Author:
David S. Moore, George P. McCabe, Bruce A. Craig
Publisher:
W. H. Freeman