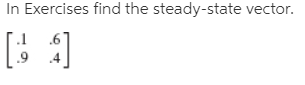
In Exercises find the steady-state vector. .6 .9


Q: Q3: price receivea ior the clocks depends on both the age of the clocks and the number of bidders at…
A: Given: The dependent variable Y is the Auction price The independent variables X1, X2 are Age and…
Q: The data in the accompanying table represent the heights and weights of a random sample of…
A: The data shows the heights and weights of a random sample of professional baseball players.
Q: 7. A/n is the difference between an obser model being studied and contains information abe B. Range…
A: Answer : A Residual is a difference between an observation (yi,j) and its estimated value from the…
Q: 20 В. 36 56 The diagram shows the activities required to complete a factory process. A forward scan…
A: A forward scan has been completed for the process. Critical Path: AEGJ
Q: 00 Next erns & Communicating Assume that you quickly drink a 12 oz. soft drink containing about 48…
A: The value of caffeine remaining after t hours is given in the table. From the table it is clear that…
Q: nutritionist claims that the mean tuna consumption by a person is 3.3 pounds per year. A sample of…
A: The following null and alternative hypotheses need to be tested: Ho: \mu = 3.3μ=3.3 Ha: \mu =\not…
Q: llustration 22.11. Given the following table for Ik the number of rabbits living at age x, complete…
A:
Q: dietitian wishes to see if a person’s cholesterol level will change if the diet is supplemented by a…
A: Given information: subject Before After d-Before-After 1 207 212 -5 2 210 200 10 3 190 188…
Q: e ) The false negative of the predicting equation is ƒ e = f =
A: A 2x2 classification table is used to analyze the relation between the observed counts and the…
Q: 3. The table below shows the number of absences in a class and the final exam grade of 7 randomly…
A: The independent variable is number of absences. The dependent variable is final exam grade. This is…
Q: The table below shows some data from the early days of the Italian clothing company Benetton. Each…
A:
Q: Carl Wright, Inc. specializes in direct mail coupon advertising for major food manufacturers. One…
A: a) 2 – Period moving average calculation is shown in Excel, All the formula is shown below…
Q: 3. The table below shows the number of absences in a class and the final exam grade of 7 randomly…
A:
Q: Education Less than high school 3599 High school graduate/GED 8000 Some college/tech school 10,408…
A:
Q: between the variables? (The information in this exercise will be used for Exercise 23 in Section…
A: The linear relationship between two continuous variables is described with the use of correlation.
Q: Level Before Mineral 210 235 208 190 172 244 Level After Mineral 190 170 210 188 173…
A:
Q: Disk drives 2016 again Recall the data on disk drives we saw in Chapter 6, Exercise 4. Suppose we…
A: Note: Hi there! Thank you for posting the question. As your question has more than 3 parts, we have…
Q: An important concern in the study of heat transfer is to determine the steady-state temperature…
A: The given system of equation is:
Q: Q.3. A rental management executive has collected data on square footage and monthly rental fee for…
A: REGRESSION ANALYSIS
Q: 2. In Canada, fuel consumption ratings for vehicles are expressed in L/100 km, or the number of…
A: We need to find equation of line that best fits.
Q: The average GPA of all 3000 students at a college is 2.84. A sample of 100 students has a mean GPA…
A: We have given that Population size N= 3000 Population mean = 2.84 Sample size n= 100 Sample mean…
Q: (A) If the animal is initially in the woods, what is the probability that it is in the woods on the…
A:
Q: e data, 12 8 10 2 ue of
A:
Q: An agricultural economist assumes that there is a linear relationship between the amounts of…
A:
Q: 3. The table below shows the number of absences in a class and the final exam grade of 7 randomly…
A: Given: X Y 1 95 0 90 2 90 6 55 4 70 3 80 3 85 Level of significance = 0.05
Q: Maintaining your balance may get harder as you grow older. A study was conducted to see how steady…
A: As per our guidelines we can solve first three subpart and rest can be reposted. Solution-: We find…
Q: The data in the accompanying table represent the heights and weights of a random sample of…
A: The null and alternative hypotheses are given below: Null Hypothesis: H0:β1=0 Alternative…
Q: The volatility of a stock is often measured by its beta value. More information about beta values is…
A: Beta Value : Beta is a statistical measure of the volatility of a stock versus the overall market.…
Q: Calculate and enter test statistic Enter value in decimal form rounded to nearest ten-thousandth,…
A: We have given that Population Mean (\mu)(μ) = 18.12518.125 Sample Standard Deviation (s)(s) =…
Q: Question * If the function is a normalization then the formula f"Y * Ydt gives the probability that…
A: It is an important part of statistics. It is widely used.
Q: Refer to the clinical measurements example discussed in the week 1 lecture. Four measurements were…
A: A scatter plot matrix for chest and waist is given. It shows the relationship between the chest and…
Q: Scatterplots Which of the scatterplots below showa) little or no association?b) a negative…
A: Solution: a) Little or no association: Scatterplot (1) does not show any pattern. Therefore, it…
Q: Q.3. A rental management executive has collected data on square footage and monthly rental fee for…
A: Lets say last two digit of your id is 40
Q: B. Determine the test statistic. ____ C. Do the results support the theory that because the…
A: Given data of penalty kick direction and goal keeper jump as shown belowHere we use Chi square test…
Q: - A math teacher asked her students about the amount of sleep they had the night before a test. The…
A: Given data :
Q: #32 What type of model should be used to make a prediction from the given data? (0,3), (2,4),…
A:
Q: Let ŷ represent the profit (or loss) for a certain company x years after 1965. Based on the data…
A: From the given information, The regression equation is y^=1.17x+8.29 Given x years after 1965. That…
Q: nspectors to identify which parts are actually defective. To test this theory, Brawdy Plastics…
A: Given, Let X be the line speed and Y be the number of defective parts found Line speed Number of…
Q: A corn breeder wishes to improve yield. As part of their work, the narrow-sense heritability for…
A: Given that: A corn breeder wishes to improve yield. As part of their work, the narrow-sense…
Q: 3. The scatter plot shows the annual incomes of a random sample of commuters and the number of…
A: From scatter plot
Q: 6. The scatter plot shows the minutes played in a game by a basketball player and the points scored…
A:
Q: Discuss what G. E. P. Box might have meant when he wrote “All models are wrong but some are useful.”
A: Model validation:Model validation is the process of checking whether a model is valid for predicting…
Q: c. D.
A:
Q: edo exercises 17 and 18 in section 8.1 of your textbook, about the small animal who lives in an area…
A: Probability: The ratio of the number of outcomes favourable for the event to the total number of…
Q: the maximum exercise heart rate for a person who is 72.
A: Let A Zumba instructor remembers the data given in the following table, which shows the recommended…
Q: 06. The data below gives the project completed time in hours by 8 IUB students who participated…
A: a. In this case training time (x) is the independent variable and project completing time (y) is the…
Q: In physics, Hooke's law states that (within certain limits) there is a linear relation between the…
A: From the given table we try to estimate a line (using linear regression formula).
Q: LA disk drive has a constant failure rate and an MTTF of 5000 hr. (a) What will the probability of…
A: Please note that as per our guidelines if multiple subparts are there in a question we can answer…
Q: Maintaining your balance may get harder as you grow older. A study was conducted to see how steady…
A: The data is about to see how steady the elderly is on their feet. The maintaining balance while 2013…


Trending now
This is a popular solution!

Step by step
Solved in 3 steps with 3 images

- Scatterplots Which of the scatterplots below showa) little or no association?b) a negative association?c) a linear association?d) a moderately strong association?e) a very strong association?“The incidence of depression among college students is negatively correlated with the number of sunny days each year in the locale where they attend college.” This statement means that: a. a student attending college in a locale with very few sunny days will become depressed. b. if a depressed student were to move to a locale with more sunny days, the student's depression would subside. c. the chances of a college student being depressed tend to increase as the number of sunny days increases. d. the chances of a college student being depressed tend to increase as there are fewer sunny days.Which of the following is a research hypothesis? A. Liberals and conservatives have the same voting rates. B. The rates of that senior citizens receive moving violations are not different from rates of moving violations seen in teenagers. C. White and African Americans watch the same amount of TV. D. Men and women have different levels of income.
- edo exercises 17 and 18 in section 8.1 of your textbook, about the small animal who lives in an area with woods and meadows, using the following data:If the animal is in the woods on one observation, then it is twice as likely to be in the woods as the meadows on the next observation. If the animal is in the meadows on one observation, then it is three times as likely to be in the meadows as the woods on the next observation.Assume that state 1 is being in the meadows and that state 2 is being in the woods.(1) Find the transition matrix for this Markov process. (2) If the animal is initially in the woods, what is the probability that it is in the woods on the next three observations? (3) If the animal is initially in the woods, what is the probability that it is in the meadow on the next three observations?Data were collected from libraries about the number of patrons who have overdue books and how long they have been using the library. Years Using Library 1 1 1.5 3 3.5 5 7 10 Number of Overdue Books 12 9 10 6 5 4 2 2 The equation ŷ = 12(0.81)x is a model that fits the data. Which of the following uses the model correctly and is an example of extrapolation? A patron who has been using the library for 2 years is predicted to have between 7 and 8 overdue books. A patron who has been using the library for 13 years is predicted to have between 6 and 7 overdue books. A patron who has been using the library for 2 years is predicted to have more than 94 overdue books. A patron who has been using the library for 13 years is predicted to have less than 1 overdue book.An agricultural economist assumes that there is a linear relationship between the amounts of fertilizer supplied to tomatoes obtained. Eight tomato plants, of the same variety, were selected at random and treated, weekly, with a solution in which x grams of fertilizer was dissolved in a fixed quantity of water. The yield, y kilograms, of tomatoes was recorded. Plants A B C D E F G H X 1.0 1.5 2.0 2.5 3.0 3.5 4.0 4.5 Y 3.9 4.4 5.8 6.6 7.0 7.1 7.3 7.7 Use a graphical method to explain if the agricultural economist was correct to assume a linear relationship between the amounts of fertilizer used and subsequent yields. Calculate the equation of the least square’s regression line. Estimate the yield of a plant treated, weekly, with 3.2 grams of fertilizer.
- Your team members conducted a study where they had participants watch a lecture video in either (a) virtual reality (VR), (b) large projector screen (PS), or (c) a computer screen (CP). They are interested in whether immersion, such as that experienced when in a learning while wearing a virtual reality helmet, increases students’ grades and decreases mind wandering in class. At one point in the middle of the lecture, participants were interrupted to answer a question about their thoughts. They answered the question, “were you thinking about something other than the lecture?” on a scale from 1 (not at all) to 9 (extremely). This question measures what psychologists call “task-unrelated thought” (TUT) and it’s a common measure of mind wandering pertaining to learning because it assesses whether students are experiencing thoughts that are off-topic and unrelated to the task at hand (i.e., listening to a lecture). At the end of the lecture, participants completed a brief quiz to measure…A rehabilitation counselor believes that an increase in the number of social visits to a patient over the course of a week in the hospital will increase the patient's daily levels of positive mood. The counselor ensures that patients are limited to only three people during each visit. What is the null hypothesis for this relationship? a. H0: r < 0 b. H0: r ≤ 0 c. H0: ρ > 0 d. H0: ρ ≤ 0Using 1964 as the origin obtain as straight line trend equation y=ax + b by the method of least squares Year 1960 1962 1963 1964 1965 1966 1969 Value 140 144 160 152 168 176 180 Find the trend value of the missing year 1961?
- Maintaining your balance may get harder as you grow older. A study was conducted to see how steady the elderly is on their feet. They had the subjects stand on a force platform and have them react to a noise. The force platform then measured how much they swayed forward and backward, and the data is in following table ("Maintaining balance while," 2013). Table: Forward/backward Sway (in mm) of Elderly Subjects 19 30 20 19 29 25 21 24 50 Do the data show that the elderly sway more than the mean forward sway of younger people, which is 18.125 mm? Test at the 5% level. (x) Select the statement that most correctly interprets the result of this test: A. The result is statistically significant at .05 level of significance. Evidence supports the claim that the mean sway forward and backward of elderly people is more than 18.125 mm, the sway of younger people. B. The result is statistically significant at .05 level of significance. There is not enough…Maintaining your balance may get harder as you grow older. A study was conducted to see how steady the elderly is on their feet. They had the subjects stand on a force platform and have them react to a noise. The force platform then measured how much they swayed forward and backward, and the data is in following table ("Maintaining balance while," 2013). Table: Forward/backward Sway (in mm) of Elderly Subjects 19 30 20 19 29 25 21 24 50 Do the data show that the elderly sway more than the mean forward sway of younger people, which is 18.125 mm? Test at the 5% level. (iv) Determine sample mean x :iv Determine sample mean x : Enter answer to nearest ten-thousandth, without units of measure. Examples of correctly entered answers: 11.2385 0.0079 3.0500 7.4000 (v) Determine sample standard deviation s :v Determine sample standard deviation s : Enter in decimal form to nearest thousandth. Do not enter units of measure. Examples…Maintaining your balance may get harder as you grow older. A study was conducted to see how steady the elderly is on their feet. They had the subjects stand on a force platform and have them react to a noise. The force platform then measured how much they swayed forward and backward, and the data is in following table ("Maintaining balance while," 2013). Table: Forward/backward Sway (in mm) of Elderly Subjects 19 30 20 19 29 25 21 24 50 Do the data show that the elderly sway more than the mean forward sway of younger people, which is 18.125 mm? Test at the 5% level. (vii) Calculate and enter test statistic Enter value in decimal form rounded to nearest ten-thousandth, with appropriate sign (no spaces). Examples of correctly entered answers: –2.0140 –0.0307 +0.6000 +1.0009 (viii) Using tables, calculator, or spreadsheet: Determine and enter p-value corresponding to test statistic. Enter value in decimal form rounded…

