In mammals, the toxicity of drugs, pesticides and chemical carcinogens can be altered by inducing liver enzyme activity. In a study on chickens, five liver enzymes had their activity induced by butylated hydroxytoluene, and the resulting percent detoxification of malathion (an organophosphate insecticide) was recorded. The experimenters believed that the response (% detoxification, DT) could be modelled by a multiple linear regression based on the activities of the individual enzymes (EAi, i = 1 to 5, measured as a percentage of normal activity): DT = b0 + b1×EA1 + b2×EA2 + b3×EA3 + b4×EA4 +b5×EA5 The results from the experiment are contained in the screenshot, which contains six variables: Detox – DT, the % detoxification of malathion by liver. EA1 – EA1, activity of enzyme 1 (% of normal activity). EA2 – EA2, activity of enzyme 2 (% of normal activity). EA3 – EA3, activity of enzyme 3 (% of normal activity). EA4 – EA4, activity of enzyme 4 (% of normal activity). EA5 – EA5, activity of enzyme 5 (% of normal activity). Perform a multiple linear regression (or univariate General Linear Model) calculation on this data, and answer the following questions based on your results. Include any relevant output from the calculation. Explain whether the overall multiple linear regression model is significant. Explain which slope parameter, if any, in the model is not Explain which enzyme activity causes the % detoxification to decrease.


In mammals, the toxicity of drugs, pesticides and chemical carcinogens can be altered by inducing liver enzyme activity. In a study on chickens, five liver enzymes had their activity induced by butylated hydroxytoluene, and the resulting percent detoxification of malathion (an organophosphate insecticide) was recorded. The experimenters believed that the response (% detoxification, DT) could be modelled by a multiple linear regression based on the activities of the individual enzymes (EAi, i = 1 to 5, measured as a percentage of normal activity):
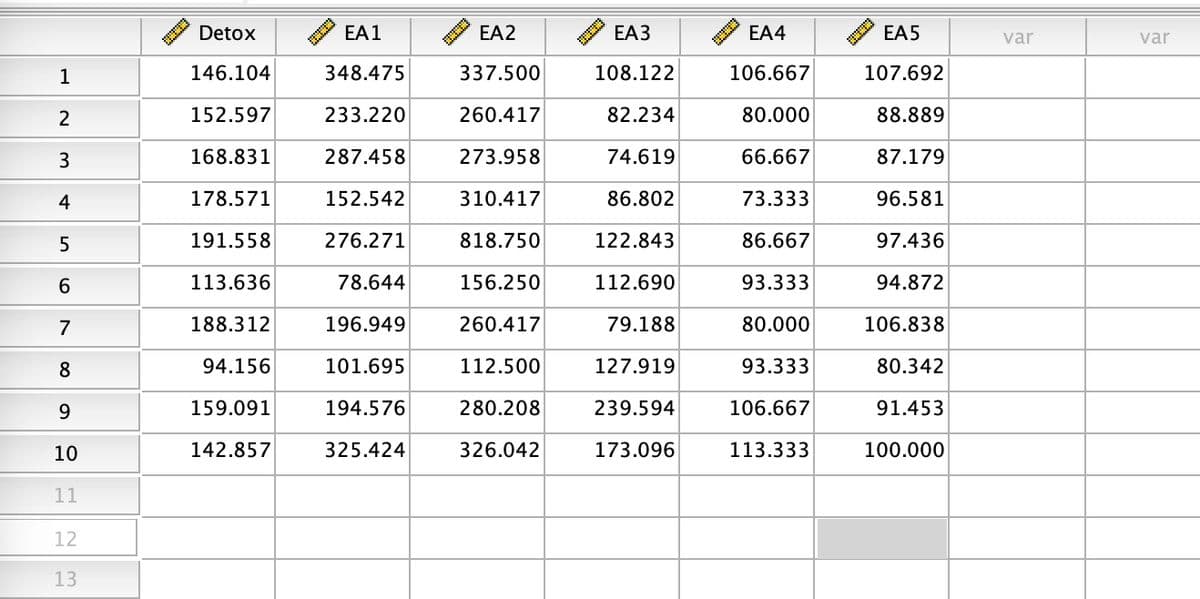
DT = b0 + b1×EA1 + b2×EA2 + b3×EA3 + b4×EA4 +b5×EA5
The results from the experiment are contained in the screenshot, which contains six variables:
- Detox – DT, the % detoxification of malathion by liver.
- EA1 – EA1, activity of enzyme 1 (% of normal activity).
- EA2 – EA2, activity of enzyme 2 (% of normal activity).
- EA3 – EA3, activity of enzyme 3 (% of normal activity).
- EA4 – EA4, activity of enzyme 4 (% of normal activity).
- EA5 – EA5, activity of enzyme 5 (% of normal activity).
Perform a multiple linear regression (or univariate General Linear Model) calculation on this data, and answer the following questions based on your results. Include any relevant output from the calculation.
- Explain whether the overall multiple linear regression model is significant.
- Explain which slope parameter, if any, in the model is not
- Explain which enzyme activity causes the % detoxification to decrease.

Step by step
Solved in 2 steps with 1 images


