Consider the chart below that shows worker's salaries at the Finy Pie Factory. Table 1: Contains employee salary information.
Consider the chart below that shows worker's salaries at the Finy Pie Factory. Table 1: Contains employee salary information.

MATLAB: An Introduction with Applications
6th Edition
ISBN:9781119256830
Author:Amos Gilat
Publisher:Amos Gilat
Chapter1: Starting With Matlab
Section: Chapter Questions
Problem 1P

Related questions
Question
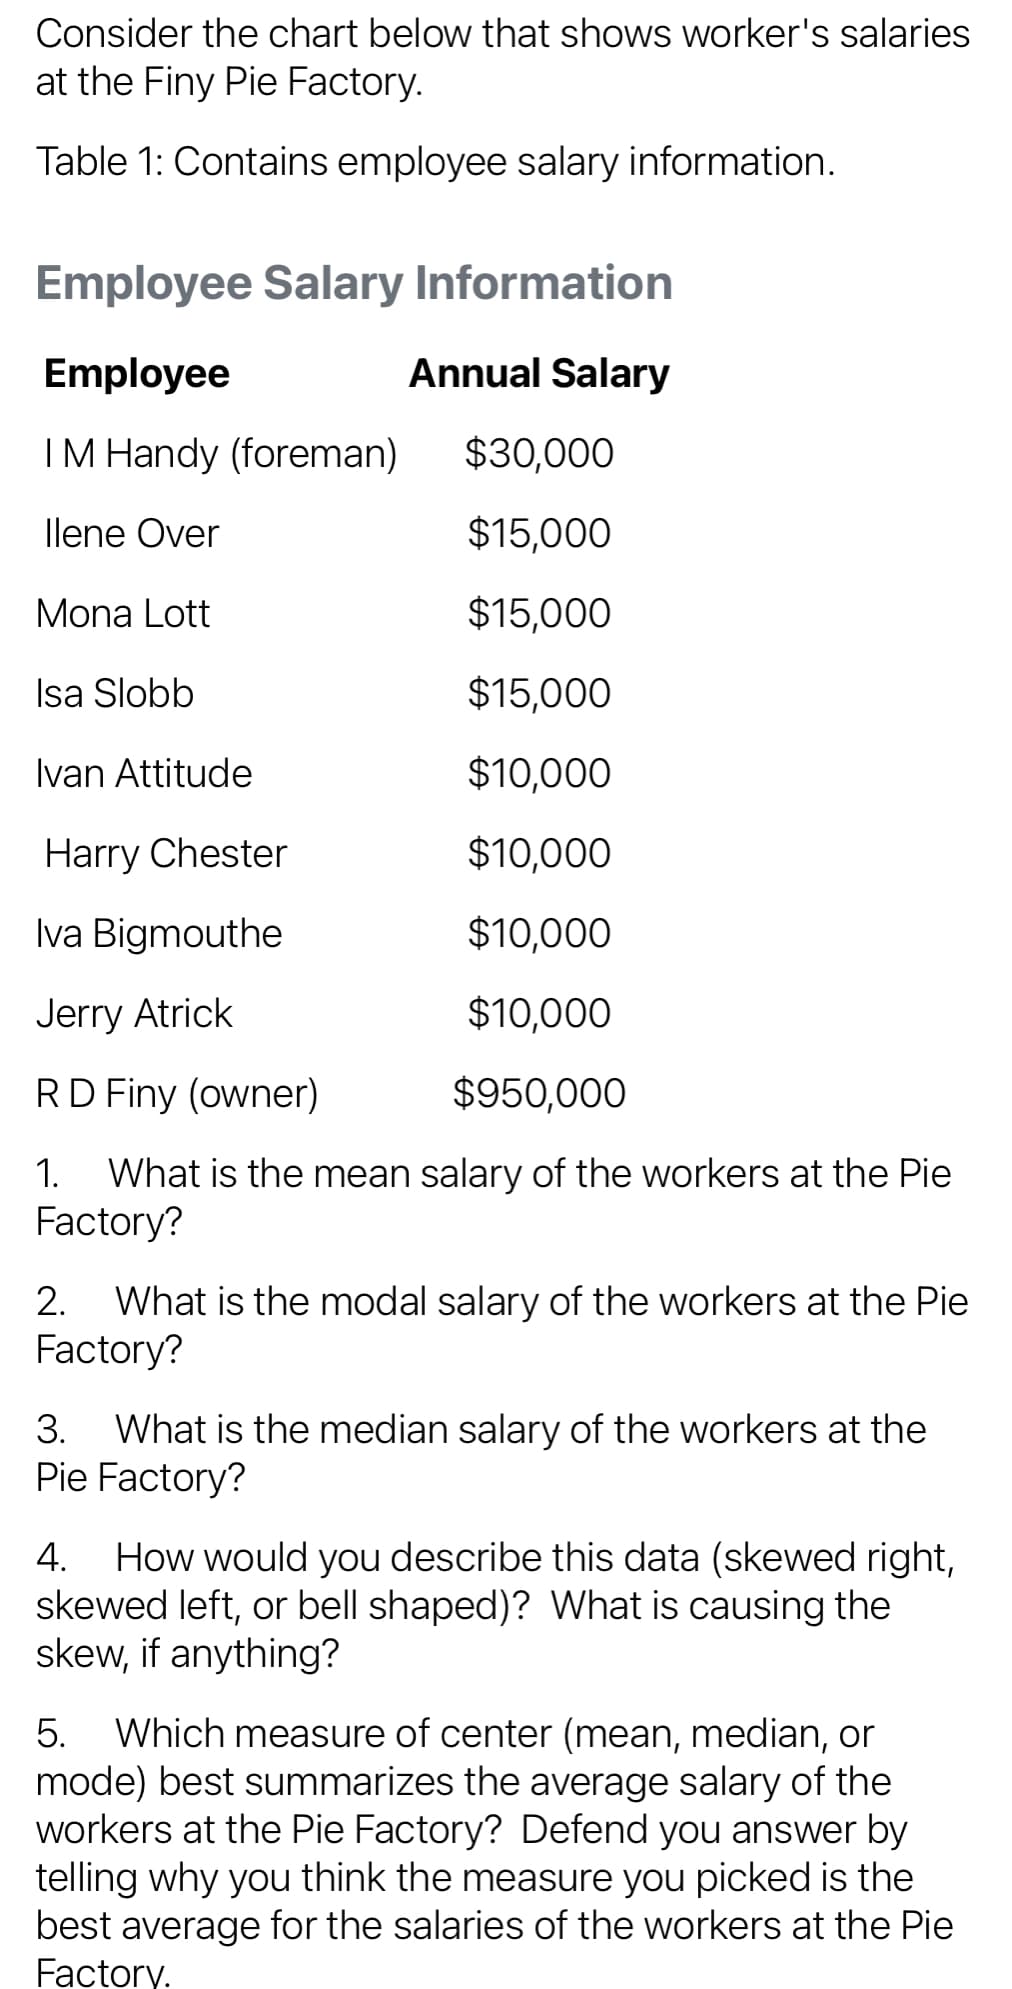
Transcribed Image Text:Consider the chart below that shows worker's salaries
at the Finy Pie Factory.
Table 1: Contains employee salary information.
Employee Salary Information
Employee
Annual Salary
IM Handy (foreman)
$30,000
llene Over
$15,000
Mona Lott
$15,000
Isa Slobb
$15,000
Ivan Attitude
$10,000
Harry Chester
$10,000
Iva Bigmouthe
$10,000
Jerry Atrick
$10,000
RD Finy (owner)
$950,000
1. What is the mean salary of the workers at the Pie
Factory?
What is the modal salary of the workers at the Pie
Factory?
2.
What is the median salary of the workers at the
Pie Factory?
3.
4. How would you describe this data (skewed right,
skewed left, or bell shaped)? What is causing the
skew, if anything?
5. Which measure of center (mean, median, or
mode) best summarizes the average salary of the
workers at the Pie Factory? Defend you answer by
telling why you think the measure you picked is the
best average for the salaries of the workers at the Pie
Factory.
Expert Solution
Step 1
Here Given data for the salary of Finy Pie factory
NOTE-AS PER POLICY I HAVE CALCULATED FIRST 3 SUBPARTS ONLY

Step by step
Solved in 4 steps

Recommended textbooks for you
MATLAB: An Introduction with Applications
Statistics
ISBN:
9781119256830
Author:
Amos Gilat
Publisher:
John Wiley & Sons Inc

Probability and Statistics for Engineering and th…
Statistics
ISBN:
9781305251809
Author:
Jay L. Devore
Publisher:
Cengage Learning

Statistics for The Behavioral Sciences (MindTap C…
Statistics
ISBN:
9781305504912
Author:
Frederick J Gravetter, Larry B. Wallnau
Publisher:
Cengage Learning
MATLAB: An Introduction with Applications
Statistics
ISBN:
9781119256830
Author:
Amos Gilat
Publisher:
John Wiley & Sons Inc
Probability and Statistics for Engineering and th…
Statistics
ISBN:
9781305251809
Author:
Jay L. Devore
Publisher:
Cengage Learning
Statistics for The Behavioral Sciences (MindTap C…
Statistics
ISBN:
9781305504912
Author:
Frederick J Gravetter, Larry B. Wallnau
Publisher:
Cengage Learning

Elementary Statistics: Picturing the World (7th E…
Statistics
ISBN:
9780134683416
Author:
Ron Larson, Betsy Farber
Publisher:
PEARSON

The Basic Practice of Statistics
Statistics
ISBN:
9781319042578
Author:
David S. Moore, William I. Notz, Michael A. Fligner
Publisher:
W. H. Freeman

Introduction to the Practice of Statistics
Statistics
ISBN:
9781319013387
Author:
David S. Moore, George P. McCabe, Bruce A. Craig
Publisher:
W. H. Freeman