In order to calculate thet statistic, you first need to calculate the standard error under the assumption that the null hypothesis is true. In order to calculate the standard error, you first need to calculate the pooled variance. The poole wariance is s The standard error is s(M1 - M2) = The t statistic is The t statistic in the critical region. Therefore, the null hypothesis is You conclude that victims have a different mean anxiety score than bully-victims. Thus, it can be said that chese two means are different from one another.
In order to calculate thet statistic, you first need to calculate the standard error under the assumption that the null hypothesis is true. In order to calculate the standard error, you first need to calculate the pooled variance. The poole wariance is s The standard error is s(M1 - M2) = The t statistic is The t statistic in the critical region. Therefore, the null hypothesis is You conclude that victims have a different mean anxiety score than bully-victims. Thus, it can be said that chese two means are different from one another.

Glencoe Algebra 1, Student Edition, 9780079039897, 0079039898, 2018
18th Edition
ISBN:9780079039897
Author:Carter
Publisher:Carter
Chapter10: Statistics
Section10.4: Distributions Of Data
Problem 19PFA

Related questions
Topic Video
Question
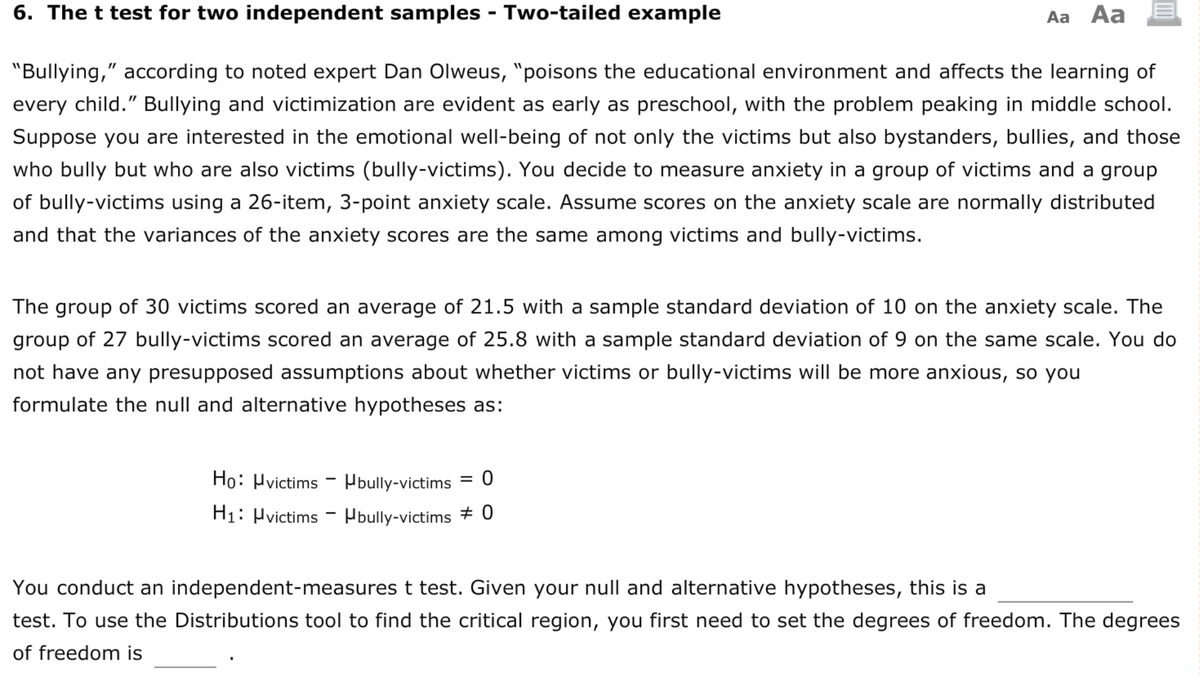
Transcribed Image Text:6. The t test for two independent samples - Two-tailed example
Aa Aa
"Bullying," according to noted expert Dan Olweus, "poisons the educational environment and affects the learning of
every child." Bullying and victimization are evident as early as preschool, with the problem peaking in middle school.
Suppose you are interested in the emotional well-being of not only the victims but also bystanders, bullies, and those
who bully but who are also victims (bully-victims). You decide to measure anxiety in a group of victims and a group
of bully-victims using a 26-item, 3-point anxiety scale. Assume scores on the anxiety scale are normally distributed
and that the variances of the anxiety scores are the same among victims and bully-victims.
The group of 30 victims scored an average of 21.5 with a sample standard deviation of 10 on the anxiety scale. The
group of 27 bully-victims scored an average of 25.8 with a sample standard deviation of 9 on the same scale. You do
not have any presupposed assumptions about whether victims or bully-victims will be more anxious, so you
formulate the null and alternative hypotheses as:
Ho: Hvictims - Pbully-victims
H1: Hvictims - Hbully-victims + 0
You conduct an independent-measures t test. Given your null and alternative hypotheses, this is a
test. To use the Distributions tool to find the critical region, you first need to set the degrees of freedom. The degrees
of freedom is
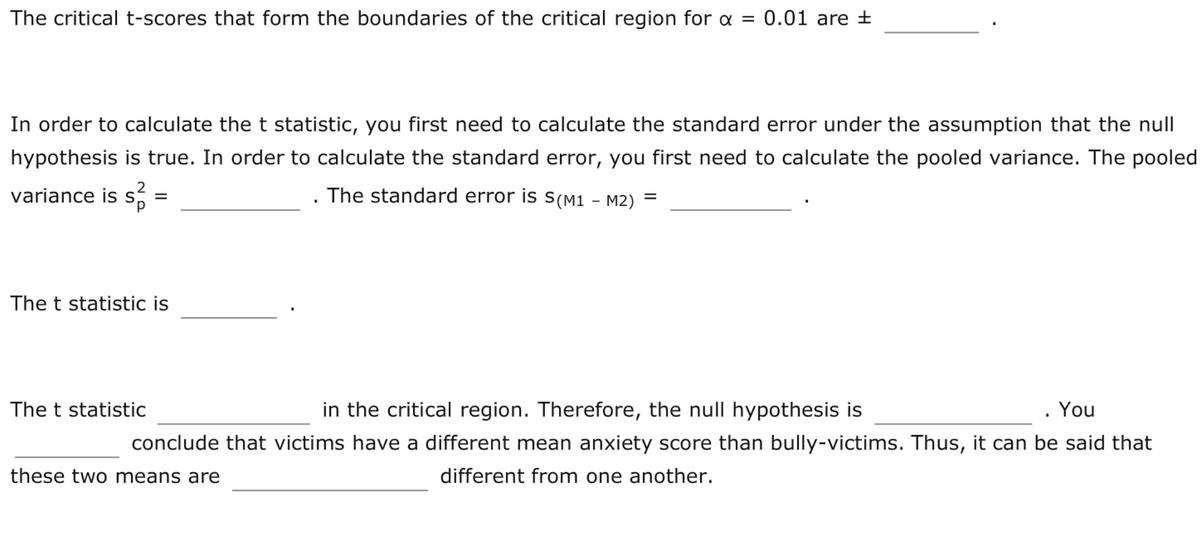
Transcribed Image Text:The critical t-scores that form the boundaries of the critical region for a = 0.01 are ±
In order to calculate the t statistic, you first need to calculate the standard error under the assumption that the null
hypothesis is true. In order to calculate the standard error, you first need to calculate the pooled variance. The pooled
variance is s:
The standard error is s(M1 - M2)
=
The t statistic is
The t statistic
in the critical region. Therefore, the null hypothesis is
. You
conclude that victims have a different mean anxiety score than bully-victims. Thus, it can be said that
these two means are
different from one another.
Expert Solution
This question has been solved!
Explore an expertly crafted, step-by-step solution for a thorough understanding of key concepts.

This is a popular solution!

Trending now
This is a popular solution!

Step by step
Solved in 2 steps

Knowledge Booster


Learn more about
Need a deep-dive on the concept behind this application? Look no further. Learn more about this topic, statistics and related others by exploring similar questions and additional content below.Recommended textbooks for you
Glencoe Algebra 1, Student Edition, 9780079039897…
Algebra
ISBN:
9780079039897
Author:
Carter
Publisher:
McGraw Hill

College Algebra (MindTap Course List)
Algebra
ISBN:
9781305652231
Author:
R. David Gustafson, Jeff Hughes
Publisher:
Cengage Learning
Glencoe Algebra 1, Student Edition, 9780079039897…
Algebra
ISBN:
9780079039897
Author:
Carter
Publisher:
McGraw Hill
College Algebra (MindTap Course List)
Algebra
ISBN:
9781305652231
Author:
R. David Gustafson, Jeff Hughes
Publisher:
Cengage Learning