in Purchase, New York. PepsiCo has interests in the manufacturing, marketing, and distribution of grain-based snack foods, beverages, and other products. PepsiCo was formed in 1965 with the merger of the Pepsi-Cola Company and Frito-Lay, Inc. PepsiCo has since expanded from its namesake product Pepsi to a broader range of food and beverage brands, the largest of which included an acquisition of Tropicana Products in 1998 and the Quaker Oats Company in 2001, which added the Gatorade brand to its portfolio. As of January 26, 2012, 22 of PepsiCo's brands generated retail sales of more than $1 billion apiece, and the company's products were distributed across more than 200 countries, resulting in annual net revenues of $43.3 billion. Based on net revenue, PepsiCo is the second largest food and beverage business in the world. Your consulting firm has been hired to forecast the total revenues for PepsiCo, Inc. for each quarter of 2021. The company's past seasonal revenues are located below. Total Revenues ($millions) Quarter 2 $15,710 $16,090 $16,449 $15,945 Fiscal Year (FY) Quarter 1 $12,049 $12,562 $12,884 $13,881 Quarter 3 $16,240 $16,485 $17,188 $18,091 Quarter 4 $19,526 $19,524 $20,640 $22,455 2017 2018 2019 2020 Before continuing to the problems below, construct a time series plot (line chart) of PepsiCo revenue data. Use the data and this chart to answer the questions below. Because the data are categorized by quarter, the forecast may need to account for seasonal impacts. Use the multiple regression model defined below to forecast PepsiCo's revenues. 1. A colleague has suggested the presence of a trend in PepsiCo’s revenues, disregarding seasonal impacts. Use the regression equations identified below to forecast using only trend. (a) Using a second-order model, develop a nonlinear estimated regression equation [T = bo + bit + bzť²] to forecast PepsiCo's revenues. Use the nonlinear equation to forecast revenues for each quarter of 2021. Using a= 0.05, discuss the significance (R-square, F-test and t-tests) of the equation in part (d). (b) Do you prefer the estimated regression equation developed in part (b) or part (d)? Explain. (c)
in Purchase, New York. PepsiCo has interests in the manufacturing, marketing, and distribution of grain-based snack foods, beverages, and other products. PepsiCo was formed in 1965 with the merger of the Pepsi-Cola Company and Frito-Lay, Inc. PepsiCo has since expanded from its namesake product Pepsi to a broader range of food and beverage brands, the largest of which included an acquisition of Tropicana Products in 1998 and the Quaker Oats Company in 2001, which added the Gatorade brand to its portfolio. As of January 26, 2012, 22 of PepsiCo's brands generated retail sales of more than $1 billion apiece, and the company's products were distributed across more than 200 countries, resulting in annual net revenues of $43.3 billion. Based on net revenue, PepsiCo is the second largest food and beverage business in the world. Your consulting firm has been hired to forecast the total revenues for PepsiCo, Inc. for each quarter of 2021. The company's past seasonal revenues are located below. Total Revenues ($millions) Quarter 2 $15,710 $16,090 $16,449 $15,945 Fiscal Year (FY) Quarter 1 $12,049 $12,562 $12,884 $13,881 Quarter 3 $16,240 $16,485 $17,188 $18,091 Quarter 4 $19,526 $19,524 $20,640 $22,455 2017 2018 2019 2020 Before continuing to the problems below, construct a time series plot (line chart) of PepsiCo revenue data. Use the data and this chart to answer the questions below. Because the data are categorized by quarter, the forecast may need to account for seasonal impacts. Use the multiple regression model defined below to forecast PepsiCo's revenues. 1. A colleague has suggested the presence of a trend in PepsiCo’s revenues, disregarding seasonal impacts. Use the regression equations identified below to forecast using only trend. (a) Using a second-order model, develop a nonlinear estimated regression equation [T = bo + bit + bzť²] to forecast PepsiCo's revenues. Use the nonlinear equation to forecast revenues for each quarter of 2021. Using a= 0.05, discuss the significance (R-square, F-test and t-tests) of the equation in part (d). (b) Do you prefer the estimated regression equation developed in part (b) or part (d)? Explain. (c)

Linear Algebra: A Modern Introduction
4th Edition
ISBN:9781285463247
Author:David Poole
Publisher:David Poole
Chapter2: Systems Of Linear Equations
Section2.4: Applications
Problem 28EQ

Related questions
Question
Solve on excel
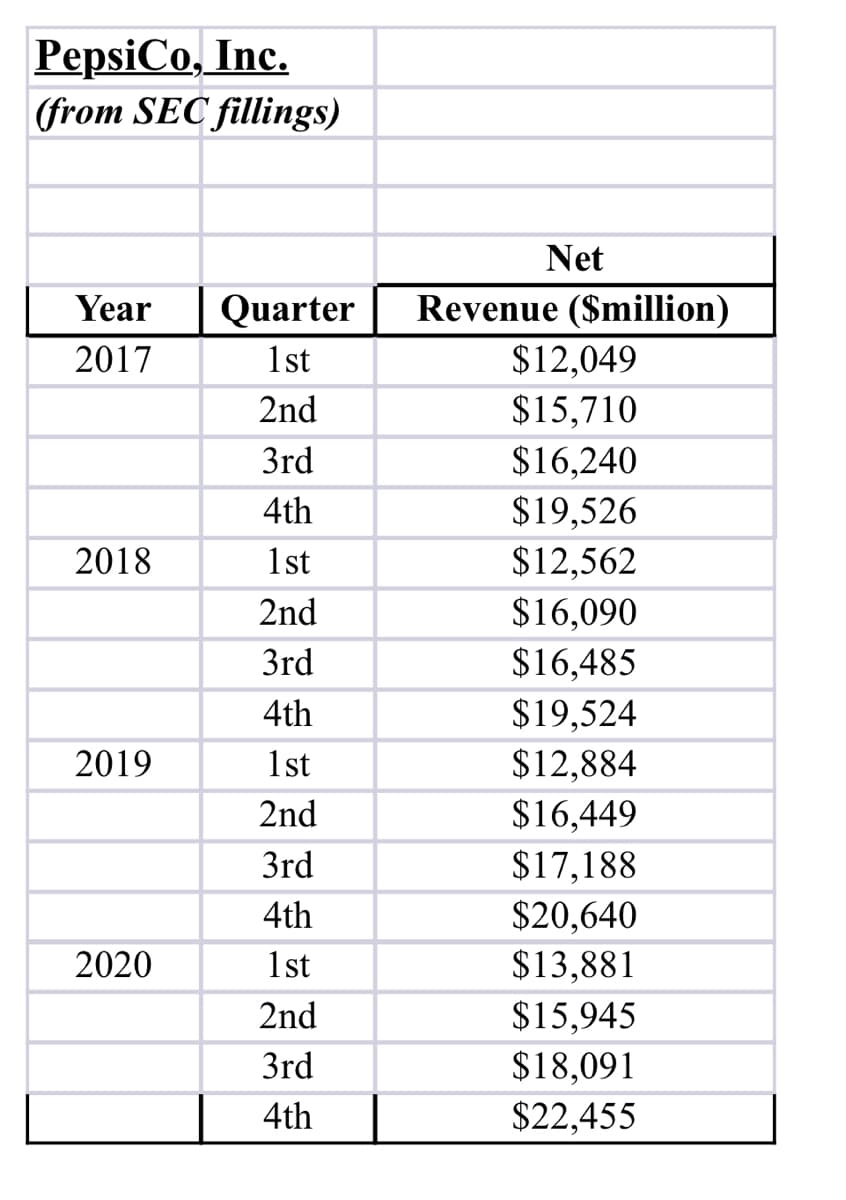
Transcribed Image Text:PepsiCo, Inc.
(from SEC fillings)
Net
Revenue ($million)
Quarter
1st
Year
2017
$12,049
2nd
$15,710
3rd
$16,240
4th
$19,526
2018
1st
$12,562
2nd
$16,090
3rd
$16,485
$19,524
$12,884
4th
2019
1st
2nd
$16,449
$17,188
$20,640
$13,881
3rd
4th
2020
1st
$15,945
$18,091
$22,455
2nd
3rd
4th
![PepsiCo, Inc. is an American multinational food, snack, and beverage corporation headquartered
in Purchase, New York. PepsiCo has interests in the manufacturing, marketing, and distribution
of grain-based snack foods, beverages, and other products. PepsiCo was formed in 1965 with the
merger of the Pepsi-Cola Company and Frito-Lay, Inc. PepsiCo has since expanded from its
namesake product Pepsi to a broader range of food and beverage brands, the largest of which
included an acquisition of Tropicana Products in 1998 and the Quaker Oats Company in 2001,
which added the Gatorade brand to its portfolio.
As of January 26, 2012, 22 of PepsiCo's brands generated retail sales of more than $1 billion
apiece, and the company's products were distributed across more than 200 countries, resulting in
annual net revenues of $43.3 billion. Based on net revenue, PepsiCo is the second largest food
and beverage business in the world.
Your consulting firm has been hired to forecast the total revenues for PepsiCo, Inc. for each
quarter of 2021. The company's past seasonal revenues are located below.
Total Revenues ($millions).
Quarter 2
$15,710
$16,090
$16,449
$15,945
Fiscal Year (FY)
Quarter 1
$12,049
$12,562
$12,884
$13,881
Quarter 3
$16,240
$16,485
$17,188
$18,091
Quarter 4
$19,526
$19,524
$20,640
$22,455
2017
2018
2019
2020
Before continuing to the problems below, construct a time series plot (line chart) of
PepsiCo revenue data. Use the data and this chart to answer the questions below.
Because the data are categorized by quarter, the forecast may need to account for seasonal
impacts. Use the multiple regression model defined below to forecast PepsiCo's revenues.
1. A colleague has suggested the presence of a trend in PepsiCo’s revenues, disregarding
seasonal impacts. Use the regression equations identified below
ABC
forecast using only
trend.
Using a second-order model, develop a nonlinear estimated regression equation
[T = bo + bit + bzť²] to forecast PepsiCo's revenues. Use the nonlinear equation
to forecast revenues for each quarter of 2021.
(a)
(b)
Using a = 0.05, discuss the significance (R-square, F-test and t-tests) of the
equation in part (d).
Do you prefer the estimated regression equation developed in part (b) or part (d)?
Explain.
(c)](/v2/_next/image?url=https%3A%2F%2Fcontent.bartleby.com%2Fqna-images%2Fquestion%2Fb4fd4aa7-ffaa-45f5-a4ad-104dc0e7ed8a%2Fa2353674-4854-44fb-a439-72f1aaea47c4%2F15rpo4n_processed.jpeg&w=3840&q=75)
Transcribed Image Text:PepsiCo, Inc. is an American multinational food, snack, and beverage corporation headquartered
in Purchase, New York. PepsiCo has interests in the manufacturing, marketing, and distribution
of grain-based snack foods, beverages, and other products. PepsiCo was formed in 1965 with the
merger of the Pepsi-Cola Company and Frito-Lay, Inc. PepsiCo has since expanded from its
namesake product Pepsi to a broader range of food and beverage brands, the largest of which
included an acquisition of Tropicana Products in 1998 and the Quaker Oats Company in 2001,
which added the Gatorade brand to its portfolio.
As of January 26, 2012, 22 of PepsiCo's brands generated retail sales of more than $1 billion
apiece, and the company's products were distributed across more than 200 countries, resulting in
annual net revenues of $43.3 billion. Based on net revenue, PepsiCo is the second largest food
and beverage business in the world.
Your consulting firm has been hired to forecast the total revenues for PepsiCo, Inc. for each
quarter of 2021. The company's past seasonal revenues are located below.
Total Revenues ($millions).
Quarter 2
$15,710
$16,090
$16,449
$15,945
Fiscal Year (FY)
Quarter 1
$12,049
$12,562
$12,884
$13,881
Quarter 3
$16,240
$16,485
$17,188
$18,091
Quarter 4
$19,526
$19,524
$20,640
$22,455
2017
2018
2019
2020
Before continuing to the problems below, construct a time series plot (line chart) of
PepsiCo revenue data. Use the data and this chart to answer the questions below.
Because the data are categorized by quarter, the forecast may need to account for seasonal
impacts. Use the multiple regression model defined below to forecast PepsiCo's revenues.
1. A colleague has suggested the presence of a trend in PepsiCo’s revenues, disregarding
seasonal impacts. Use the regression equations identified below
ABC
forecast using only
trend.
Using a second-order model, develop a nonlinear estimated regression equation
[T = bo + bit + bzť²] to forecast PepsiCo's revenues. Use the nonlinear equation
to forecast revenues for each quarter of 2021.
(a)
(b)
Using a = 0.05, discuss the significance (R-square, F-test and t-tests) of the
equation in part (d).
Do you prefer the estimated regression equation developed in part (b) or part (d)?
Explain.
(c)
Expert Solution
This question has been solved!
Explore an expertly crafted, step-by-step solution for a thorough understanding of key concepts.

This is a popular solution!

Trending now
This is a popular solution!

Step by step
Solved in 2 steps with 3 images

Recommended textbooks for you
Linear Algebra: A Modern Introduction
Algebra
ISBN:
9781285463247
Author:
David Poole
Publisher:
Cengage Learning
Linear Algebra: A Modern Introduction
Algebra
ISBN:
9781285463247
Author:
David Poole
Publisher:
Cengage Learning