The bar charts below show the number of refugees admitted to the states by nationality region. Number of refugees admitted each fiscal year into the U.S., in thousands, by region of nationality Africa Middle East Asla-Pacific Europe Americas 3.000 16.000 20.000 11.000 15.000 6.000 5,000 2,000 2,000 2,000 2002 2017 2002 2017 2002 2017 2002 2017 2002 2017 Nose: Fiscal yearstaris Oct. 1. See appendir Cfor classification of countries into reglons Numbers are rounded to the neaseszthousand Source: Pew Research Centeransysis of U.S. Stse Departnent's Relugee Processing Center data (Demagraphic Prafite), accessed Get. 2, 2017. "U.S. Resetles Fewer Refuge es Evenes GlobalNumberof Displaced People Gravs" Type heret a. What conclusions can you draw from these graphs? Write at least 3 sentences in your response. b. Calculate the absolute change and relative change (to nearest tenth percent) for refugees admitted to the US from the Africa. Interpret these values in a sentence.
The bar charts below show the number of refugees admitted to the states by nationality region. Number of refugees admitted each fiscal year into the U.S., in thousands, by region of nationality Africa Middle East Asla-Pacific Europe Americas 3.000 16.000 20.000 11.000 15.000 6.000 5,000 2,000 2,000 2,000 2002 2017 2002 2017 2002 2017 2002 2017 2002 2017 Nose: Fiscal yearstaris Oct. 1. See appendir Cfor classification of countries into reglons Numbers are rounded to the neaseszthousand Source: Pew Research Centeransysis of U.S. Stse Departnent's Relugee Processing Center data (Demagraphic Prafite), accessed Get. 2, 2017. "U.S. Resetles Fewer Refuge es Evenes GlobalNumberof Displaced People Gravs" Type heret a. What conclusions can you draw from these graphs? Write at least 3 sentences in your response. b. Calculate the absolute change and relative change (to nearest tenth percent) for refugees admitted to the US from the Africa. Interpret these values in a sentence.

Chapter9: Sequences, Probability And Counting Theory
Section9.5: Counting Principles
Problem 43SE: A wholesale T-shirt company oilers sizes small, medium, large, and extra-large in organic or non-...

Related questions
Question
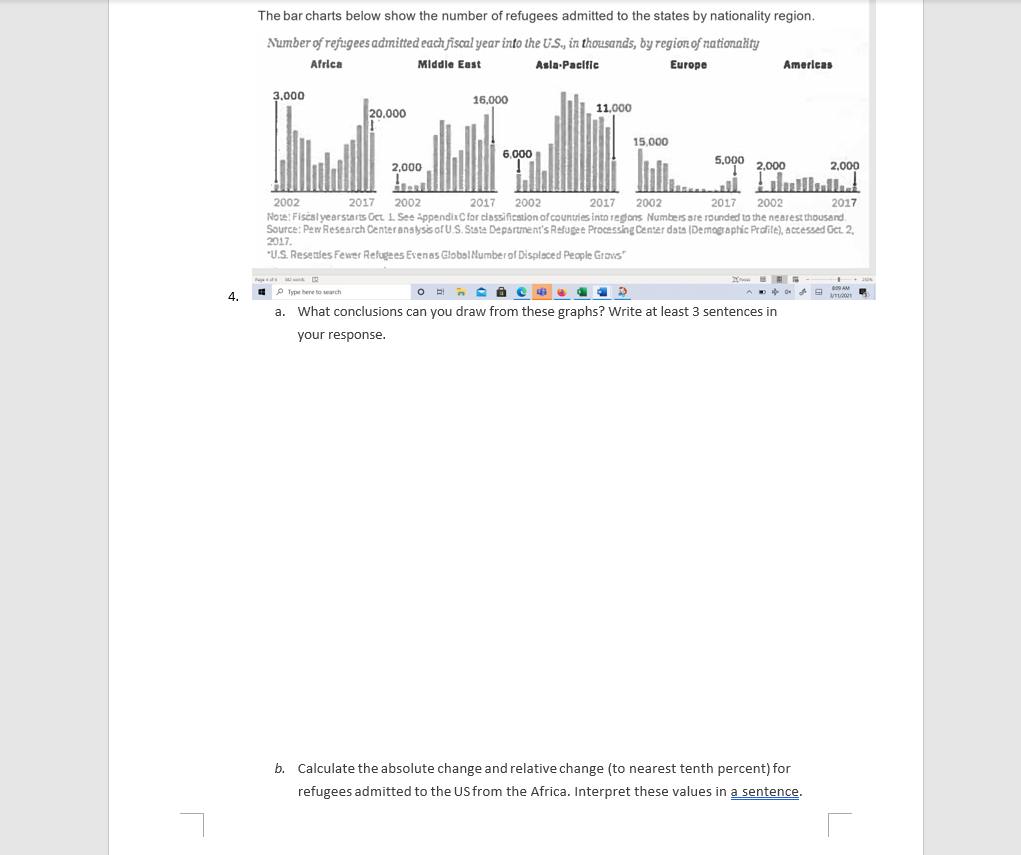
Transcribed Image Text:The bar charts below show the number of refugees admitted to the states by nationality region.
Number of refugees admitted each fiscal year into the U.S., in thousands, by region of nationality
Africa
Middle East
Asla-Pacific
Europe
Amerlcas
3.000
16,000
20.000
11,000
15,000
6,000
5,000 2,000
2,000
2,000
2002
2017 2002
2017 2002
2017
2002
2017 2002
2017
Note: Fiscsl yearstars Oct. 1. See AppendixCfor classification of countries into reglons Numbers are rounded to the nearest thousand.
Source: Pew Research Centeranslysis of U.S. Stste Depsrument's Refugee Processing Center data (Demagraphic Prafite), accessed Gct. 2,
2017.
*U.S. Reseties Fewer Refugees Evenes Global Numberof Displaced People Grovs"
ag
1 P Type here to search
4.
AM
a. What conclusions can you draw from these graphs? Write at least 3 sentences in
your response.
b. Calculate the absolute change and relative change (to nearest tenth percent) for
refugees admitted to the US from the Africa. Interpret these values in a sentence.
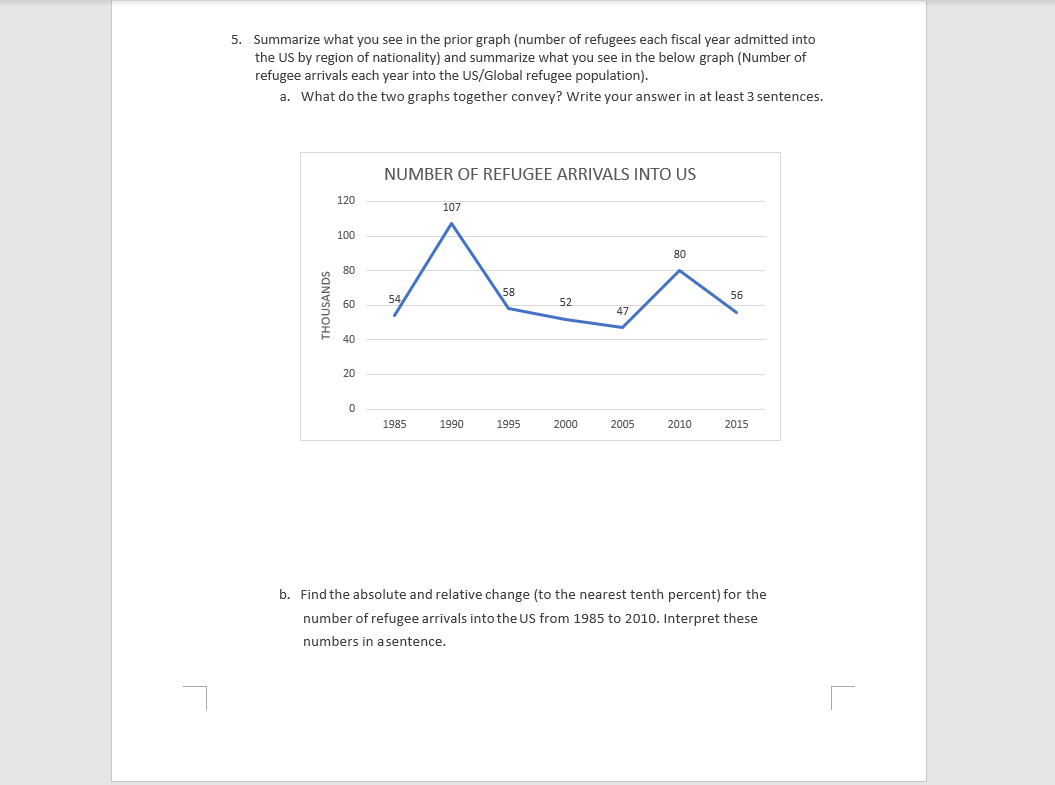
Transcribed Image Text:5. Summarize what you see in the prior graph (number of refugees each fiscal year admitted into
the US by region of nationality) and summarize what you see in the below graph (Number of
refugee arrivals each year into the US/Global refugee population).
a. What do the two graphs together convey? Write your answer in at least 3 sentences.
NUMBER OF REFUGEE ARRIVALS INTO US
120
107
100
80
80
58
56
54
52
60
47
40
20
1985
1990
1995
2000
2005
2010
2015
b. Find the absolute and relative change (to the nearest tenth percent) for the
number of refugee arrivals into the US from 1985 to 2010. Interpret these
numbers in a sentence.
Expert Solution
This question has been solved!
Explore an expertly crafted, step-by-step solution for a thorough understanding of key concepts.

This is a popular solution!

Trending now
This is a popular solution!

Step by step
Solved in 2 steps

Recommended textbooks for you

Glencoe Algebra 1, Student Edition, 9780079039897…
Algebra
ISBN:
9780079039897
Author:
Carter
Publisher:
McGraw Hill
Glencoe Algebra 1, Student Edition, 9780079039897…
Algebra
ISBN:
9780079039897
Author:
Carter
Publisher:
McGraw Hill