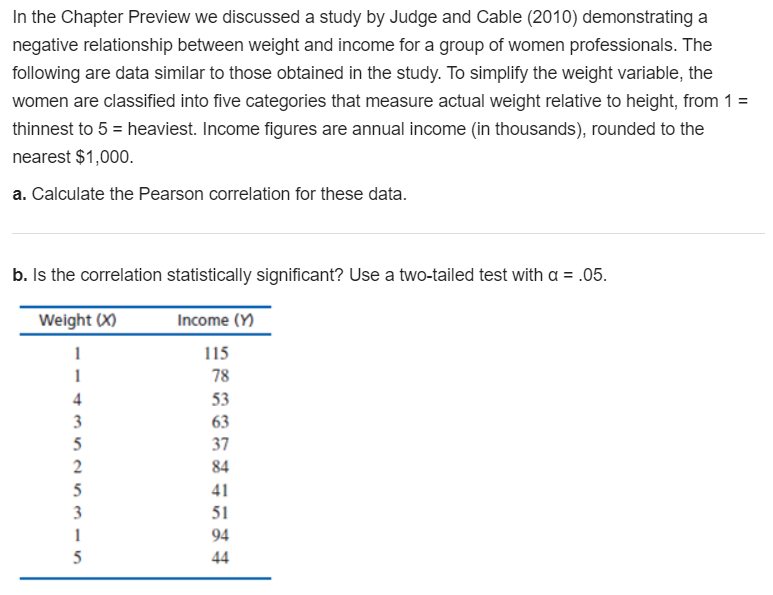
In the Chapter Preview we discussed a study by Judge and Cable (2010) demonstrating a negative relationship between weight and income for a group of women professionals. The following are data similar to those obtained in the study. To simplify the weight variable, the women are classified into five categories that measure actual weight relative to height, from 1 = thinnest to 5 = heaviest. Income figures are annual income (in thousands), rounded to the nearest $1,000. a. Calculate the Pearson correlation for these data. b. Is the correlation statistically significant? Use a two-tailed test with a = .05. Weight (X) Income (Y) 1 115 78 53 63 37 84 41 51 94 44
In the Chapter Preview we discussed a study by Judge and Cable (2010) demonstrating a negative relationship between weight and income for a group of women professionals. The following are data similar to those obtained in the study. To simplify the weight variable, the women are classified into five categories that measure actual weight relative to height, from 1 = thinnest to 5 = heaviest. Income figures are annual income (in thousands), rounded to the nearest $1,000. a. Calculate the Pearson correlation for these data. b. Is the correlation statistically significant? Use a two-tailed test with a = .05. Weight (X) Income (Y) 1 115 78 53 63 37 84 41 51 94 44

Big Ideas Math A Bridge To Success Algebra 1: Student Edition 2015
1st Edition
ISBN:9781680331141
Author:HOUGHTON MIFFLIN HARCOURT
Publisher:HOUGHTON MIFFLIN HARCOURT
Chapter4: Writing Linear Equations
Section: Chapter Questions
Problem 14CR

Related questions
Question
Transcribed Image Text:In the Chapter Preview we discussed a study by Judge and Cable (2010) demonstrating a
negative relationship between weight and income for a group of women professionals. The
following are data similar to those obtained in the study. To simplify the weight variable, the
women are classified into five categories that measure actual weight relative to height, from 1 =
thinnest to 5 = heaviest. Income figures are annual income (in thousands), rounded to the
nearest $1,000.
a. Calculate the Pearson correlation for these data.
b. Is the correlation statistically significant? Use a two-tailed test with a = .05.
Weight (X)
Income (Y)
1
115
78
53
63
37
84
41
51
94
44
Expert Solution
This question has been solved!
Explore an expertly crafted, step-by-step solution for a thorough understanding of key concepts.

This is a popular solution!

Trending now
This is a popular solution!

Step by step
Solved in 2 steps with 4 images

Recommended textbooks for you
Big Ideas Math A Bridge To Success Algebra 1: Stu…
Algebra
ISBN:
9781680331141
Author:
HOUGHTON MIFFLIN HARCOURT
Publisher:
Houghton Mifflin Harcourt

Glencoe Algebra 1, Student Edition, 9780079039897…
Algebra
ISBN:
9780079039897
Author:
Carter
Publisher:
McGraw Hill
Big Ideas Math A Bridge To Success Algebra 1: Stu…
Algebra
ISBN:
9781680331141
Author:
HOUGHTON MIFFLIN HARCOURT
Publisher:
Houghton Mifflin Harcourt
Glencoe Algebra 1, Student Edition, 9780079039897…
Algebra
ISBN:
9780079039897
Author:
Carter
Publisher:
McGraw Hill