On the following pages you are presented with five problems. Your job is to examine the output and discuss WRetker is a statistically significant relationship between the two variables, the pattern or direction of the relationship if the relationship is significant, and the strength of the relationship if the relationship is significant. As you discuss the strength of the relationship, you will rely on an appropriate measure of association from those that have been given. For that determination, you will need to appropriately determine the level of measurement of each of the variables being examined. Please use the Measures of Association Chart I provided to help you with your determination. You may write your responses on a separate document or next to the problems on this one.
On the following pages you are presented with five problems. Your job is to examine the output and discuss WRetker is a statistically significant relationship between the two variables, the pattern or direction of the relationship if the relationship is significant, and the strength of the relationship if the relationship is significant. As you discuss the strength of the relationship, you will rely on an appropriate measure of association from those that have been given. For that determination, you will need to appropriately determine the level of measurement of each of the variables being examined. Please use the Measures of Association Chart I provided to help you with your determination. You may write your responses on a separate document or next to the problems on this one.

Glencoe Algebra 1, Student Edition, 9780079039897, 0079039898, 2018
18th Edition
ISBN:9780079039897
Author:Carter
Publisher:Carter
Chapter4: Equations Of Linear Functions
Section4.5: Correlation And Causation
Problem 24PFA

Related questions
Question
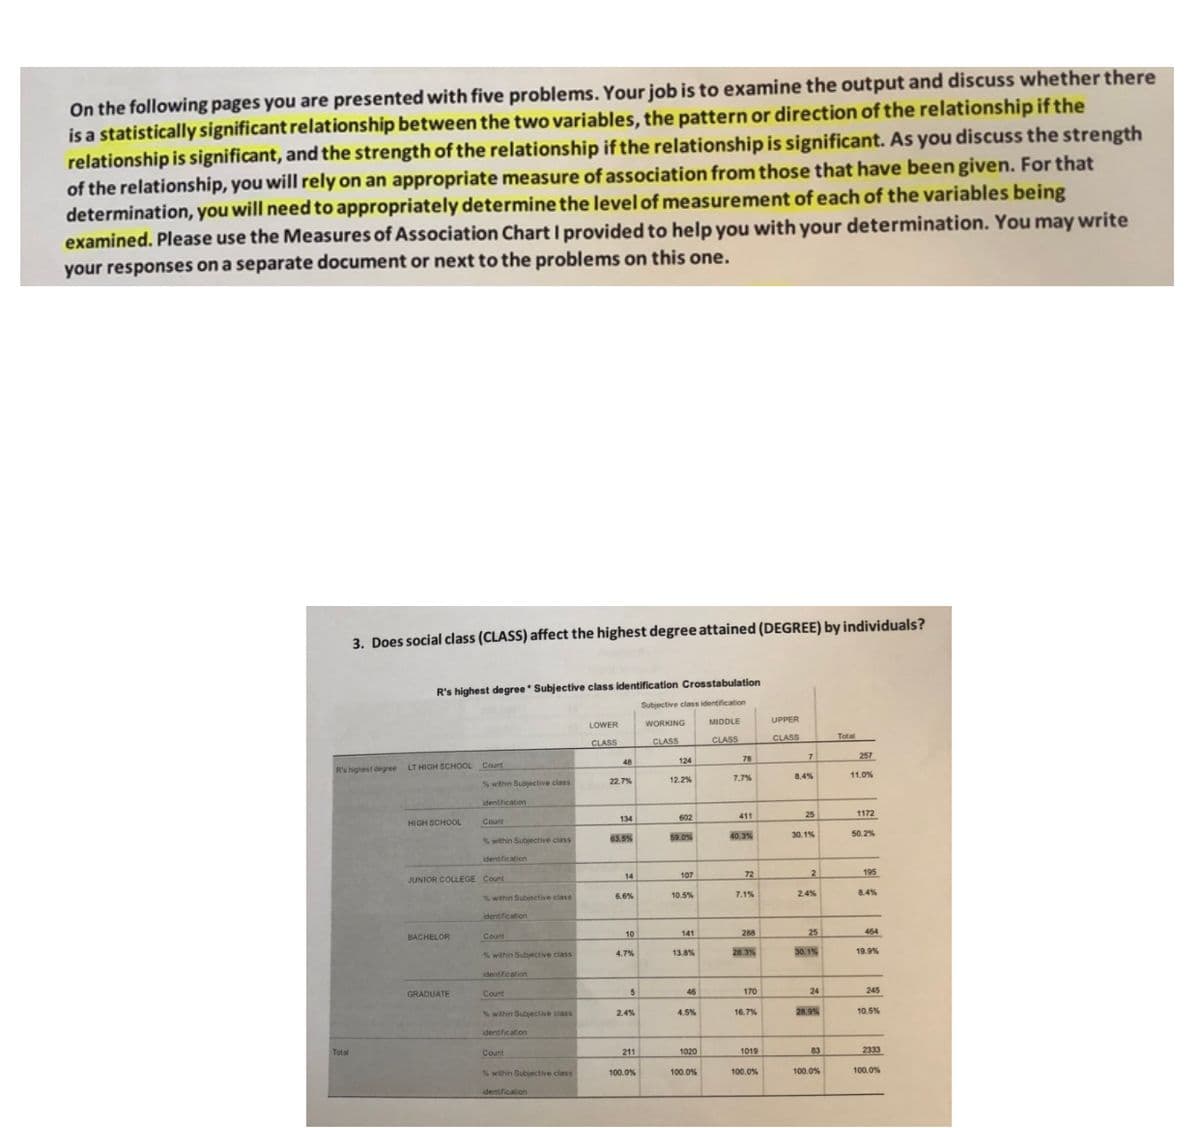
Transcribed Image Text:On the following pages you are presented with five problems. Your job is to examine the output and discuss whether there
is a statistically significant relationship between the two variables, the pattern or direction of the relationship if the
relationship is significant, and the strength of the relationship if the relationship is significant. As you discuss the strength
of the relationship, you will rely on an appropriate measure of association from those that have been given. For that
determination, you will need to appropriately determine the level of measurement of each of the variables being
examined. Please use the Measures of Association Chart I provided to help you with your determination. You may write
your responses on a separate document or next to the problems on this one.
3. Does social class (CLASS) affect the highest degree attained (DEGREE) by individuals?
R's highest degree Subjective class identification Crosstabulation
Subjective class identification
WORKING
MIDDLE
UPPER
LOWER
CLASS
CLASS
CLASS
CLASS
Total
78
257
48
124
R's highest degree
LT HIGH SCHOOL Count
7.7%
8.4%
11.0%
S within Subjective class
22.7%
12.2%
identification
602
411
25
1172
HIGH SCHOOL
Count
134
50.2%
%within Subjective class
63.5%
59.0%
40.3%
30.1%
14
107
72
195
JUNIOR COLLEGE Count
%within Subjective class
10.5%
7.1%
2.4%
8.4%
6.6%
identification
288
25
464
141
Count
Swithin Subjective class
28.3%
30. 1%
19.9%
4.7%
13.8%
identification
GRADUATE
Count
46
170
24
245
%within Subiective class
2.4%
4.5%
16.7%
28.9%
10.5%
identification
Total
Count
211
1020
1019
83
2333
s within Subjective class
100.0%
100.0%
100.0%
100.0%
100.0%
identification
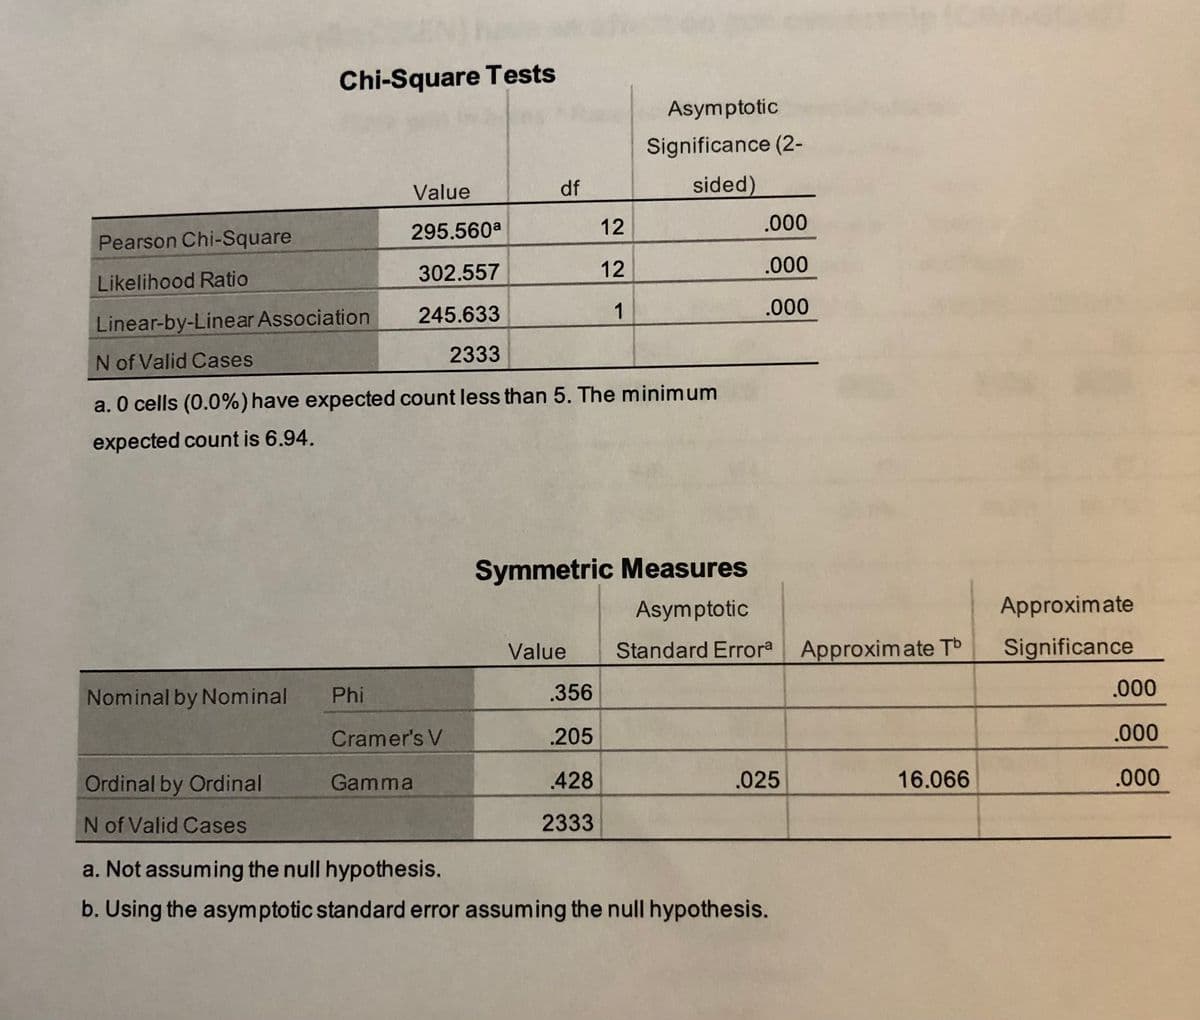
Transcribed Image Text:Chi-Square Tests
Asymptotic
Significance (2-
Value
df
sided)
295.560a
12
.000
Pearson Chi-Square
302.557
12
.000
Likelihood Ratio
245.633
1
.000
Linear-by-Linear Association
2333
N of Valid Cases
a. O cells (0.0%) have expected count less than 5. The minimum
expected count is 6.94.
Symmetric Measures
Asymptotic
Approximate
Value
Standard Errora Approximate Tb
Significance
Nominal by Nominal
Phi
.356
.000
Cramer's V
.205
.000
Ordinal by Ordinal
Gamma
428
.025
16.066
.000
N of Valid Cases
2333
a. Not assuming the null hypothesis.
b. Using the asymptotic standard error assuming the null hypothesis.
Expert Solution
This question has been solved!
Explore an expertly crafted, step-by-step solution for a thorough understanding of key concepts.

Step by step
Solved in 2 steps

Recommended textbooks for you
Glencoe Algebra 1, Student Edition, 9780079039897…
Algebra
ISBN:
9780079039897
Author:
Carter
Publisher:
McGraw Hill

Big Ideas Math A Bridge To Success Algebra 1: Stu…
Algebra
ISBN:
9781680331141
Author:
HOUGHTON MIFFLIN HARCOURT
Publisher:
Houghton Mifflin Harcourt
Glencoe Algebra 1, Student Edition, 9780079039897…
Algebra
ISBN:
9780079039897
Author:
Carter
Publisher:
McGraw Hill
Big Ideas Math A Bridge To Success Algebra 1: Stu…
Algebra
ISBN:
9781680331141
Author:
HOUGHTON MIFFLIN HARCOURT
Publisher:
Houghton Mifflin Harcourt