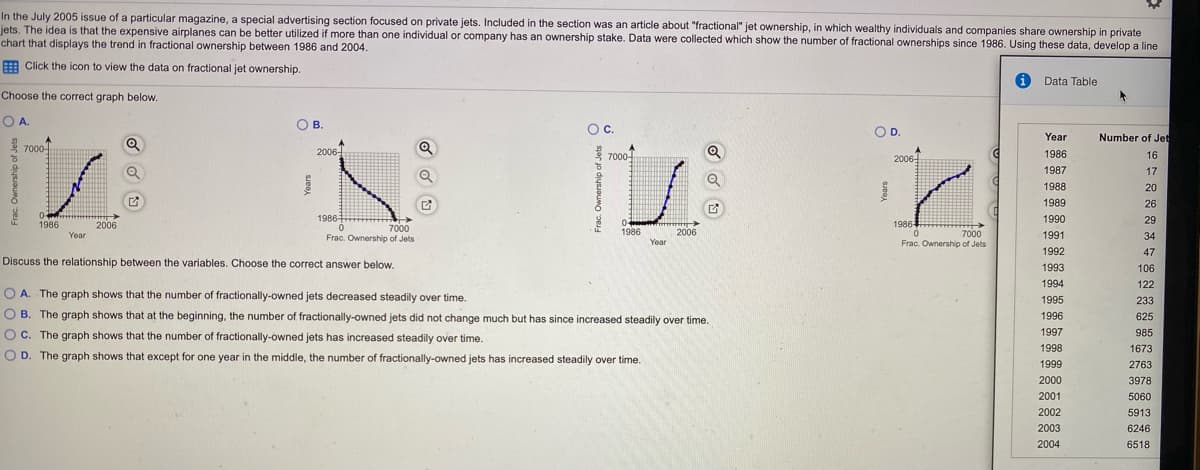
In the July 2005 issue of a particular magazine, a special advertising section focused on private jets. Included in the section was an article about "fractional" jet ownership, in which wealthy individuals and companies share ownership in private jets. The idea is that the expensive airplanes can be better utilized if more than one individual or company has an ownership stake. Data were collected which show the number of fractional ownerships since 1986. Using these data, develop a line chart that displays the trend in fractional ownership between 1986 and 2004. E Click the icon to view the data on fractional jet ownership. i Data Table Choose the correct graph below. OA. OB, В. Oc. OD. Year Number of Jet 1 7000 2006- 7000 1986 16 28 2006 1987 17 1988 20 1989 26 0- 1986 1986 1986 - 1990 29 2006 7000 Frac. Ownership of Jets 1986 2006 7000 Frac. Ownership of Jets Year 1991 34 Year 1992 47 Discuss the relationship between the variables. Choose the correct answer below. 1993 106 1994 122 O A. The graph shows that the number of fractionally-owned jets decreased steadily over time. 1995 233 O B. The graph shows that at the beginning, the number of fractionally-owned jets did not change much but has since increased steadily over time. 1996 625 O C. The graph shows that the number of fractionally-owned jets has increased steadily over time. 1997 985 1998 1673 O D. The graph shows that except for one year in the middle, the number of fractionally-owned jets has increased steadily over time. 1999 2763 2000 3978 2001 5060 2002 5913 2003 6246 2004 6518


Correlation
Correlation defines a relationship between two independent variables. It tells the degree to which variables move in relation to each other. When two sets of data are related to each other, there is a correlation between them.
Linear Correlation
A correlation is used to determine the relationships between numerical and categorical variables. In other words, it is an indicator of how things are connected to one another. The correlation analysis is the study of how variables are related.
Regression Analysis
Regression analysis is a statistical method in which it estimates the relationship between a dependent variable and one or more independent variable. In simple terms dependent variable is called as outcome variable and independent variable is called as predictors. Regression analysis is one of the methods to find the trends in data. The independent variable used in Regression analysis is named Predictor variable. It offers data of an associated dependent variable regarding a particular outcome.


Trending now
This is a popular solution!

Step by step
Solved in 3 steps with 1 images


