In the Kruskal-Wallis test for the following data, what is the sum of the ranks for Sample 1?
In the Kruskal-Wallis test for the following data, what is the sum of the ranks for Sample 1?

College Algebra (MindTap Course List)
12th Edition
ISBN:9781305652231
Author:R. David Gustafson, Jeff Hughes
Publisher:R. David Gustafson, Jeff Hughes
Chapter8: Sequences, Series, And Probability
Section8.7: Probability
Problem 7E: List the sample space of each experiment. Selecting a letter of the alphabet

Related questions
Question
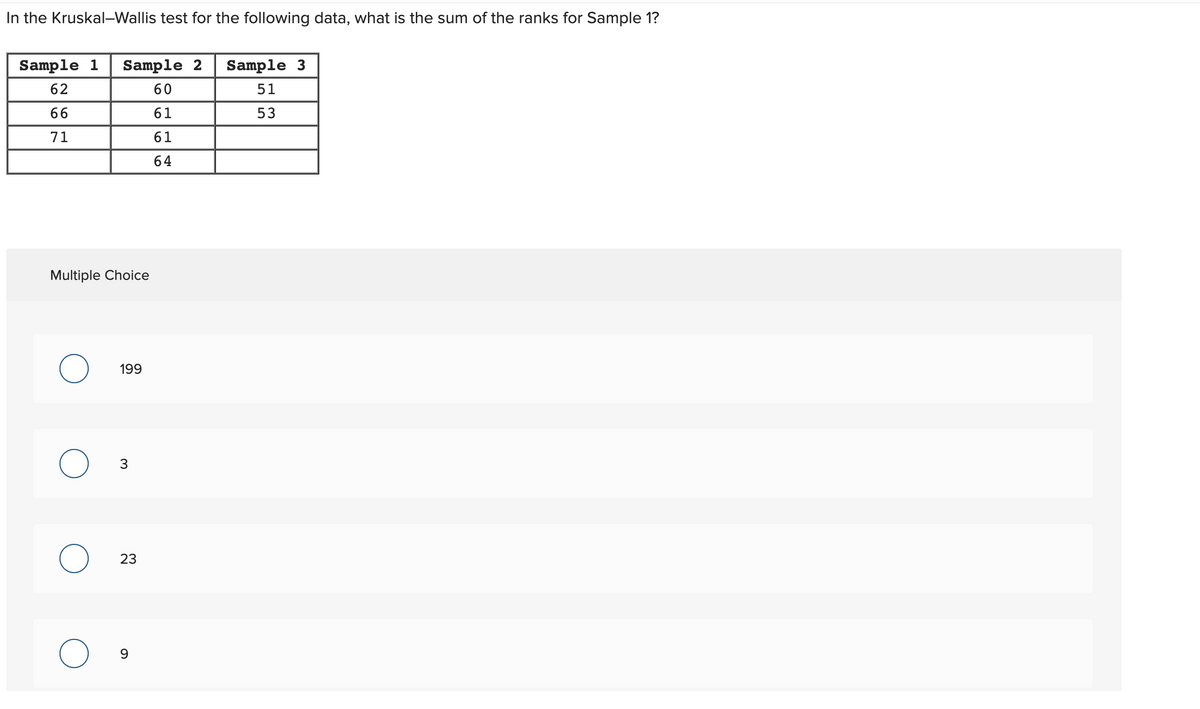
Transcribed Image Text:In the Kruskal-Wallis test for the following data, what is the sum of the ranks for Sample 1?
Sample 1
Sample 2
Sample 3
62
60
51
66
61
53
71
61
64
Multiple Choice
199
23
3.
Expert Solution
This question has been solved!
Explore an expertly crafted, step-by-step solution for a thorough understanding of key concepts.

This is a popular solution!

Trending now
This is a popular solution!

Step by step
Solved in 2 steps with 1 images

Recommended textbooks for you
College Algebra (MindTap Course List)
Algebra
ISBN:
9781305652231
Author:
R. David Gustafson, Jeff Hughes
Publisher:
Cengage Learning

College Algebra (MindTap Course List)
Algebra
ISBN:
9781305652231
Author:
R. David Gustafson, Jeff Hughes
Publisher:
Cengage Learning