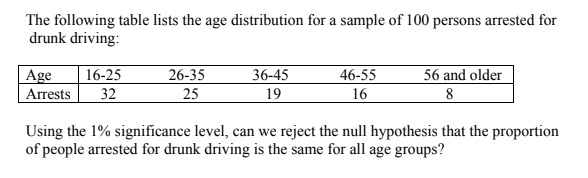
The following table lists the age distribution for a sample of 100 persons arrested for drunk driving: 16-25 Arrests 32 26-35 |25 36-45 46-55 16 Age 56 and older 19 Using the 1% significance level, can we reject the null hypothesis that the proportion of people arrested for drunk driving is the same for all age groups?
The following table lists the age distribution for a sample of 100 persons arrested for drunk driving: 16-25 Arrests 32 26-35 |25 36-45 46-55 16 Age 56 and older 19 Using the 1% significance level, can we reject the null hypothesis that the proportion of people arrested for drunk driving is the same for all age groups?

Holt Mcdougal Larson Pre-algebra: Student Edition 2012
1st Edition
ISBN:9780547587776
Author:HOLT MCDOUGAL
Publisher:HOLT MCDOUGAL
Chapter11: Data Analysis And Probability
Section: Chapter Questions
Problem 8CR

Related questions

Concept explainers
Equations and Inequations
Equations and inequalities describe the relationship between two mathematical expressions.
Linear Functions
A linear function can just be a constant, or it can be the constant multiplied with the variable like x or y. If the variables are of the form, x2, x1/2 or y2 it is not linear. The exponent over the variables should always be 1.
Question
Answer : X 2 = 16.5 , H0 is rejected
Transcribed Image Text:The following table lists the age distribution for a sample of 100 persons arrested for
drunk driving:
Age
Arrests
56 and older
8
16-25
26-35
25
36-45
46-55
16
32
19
Using the 1% significance level, can we reject the null hypothesis that the proportion
of people arrested for drunk driving is the same for all age groups?
Expert Solution
This question has been solved!
Explore an expertly crafted, step-by-step solution for a thorough understanding of key concepts.

This is a popular solution!

Trending now
This is a popular solution!

Step by step
Solved in 4 steps with 4 images

Knowledge Booster


Learn more about
Need a deep-dive on the concept behind this application? Look no further. Learn more about this topic, statistics and related others by exploring similar questions and additional content below.Recommended textbooks for you
Holt Mcdougal Larson Pre-algebra: Student Edition…
Algebra
ISBN:
9780547587776
Author:
HOLT MCDOUGAL
Publisher:
HOLT MCDOUGAL

College Algebra (MindTap Course List)
Algebra
ISBN:
9781305652231
Author:
R. David Gustafson, Jeff Hughes
Publisher:
Cengage Learning
Holt Mcdougal Larson Pre-algebra: Student Edition…
Algebra
ISBN:
9780547587776
Author:
HOLT MCDOUGAL
Publisher:
HOLT MCDOUGAL
College Algebra (MindTap Course List)
Algebra
ISBN:
9781305652231
Author:
R. David Gustafson, Jeff Hughes
Publisher:
Cengage Learning