From the following data relating to a moderately skewed distribution, find (1) coefficient of variation (ii)Pearson's Co-efficient of Skewness, and (iii) Median: Mean = 300, Mode = 290, o = 80 %3D %3D
From the following data relating to a moderately skewed distribution, find (1) coefficient of variation (ii)Pearson's Co-efficient of Skewness, and (iii) Median: Mean = 300, Mode = 290, o = 80 %3D %3D

Glencoe Algebra 1, Student Edition, 9780079039897, 0079039898, 2018
18th Edition
ISBN:9780079039897
Author:Carter
Publisher:Carter
Chapter10: Statistics
Section10.5: Comparing Sets Of Data
Problem 13PPS

Related questions
Question
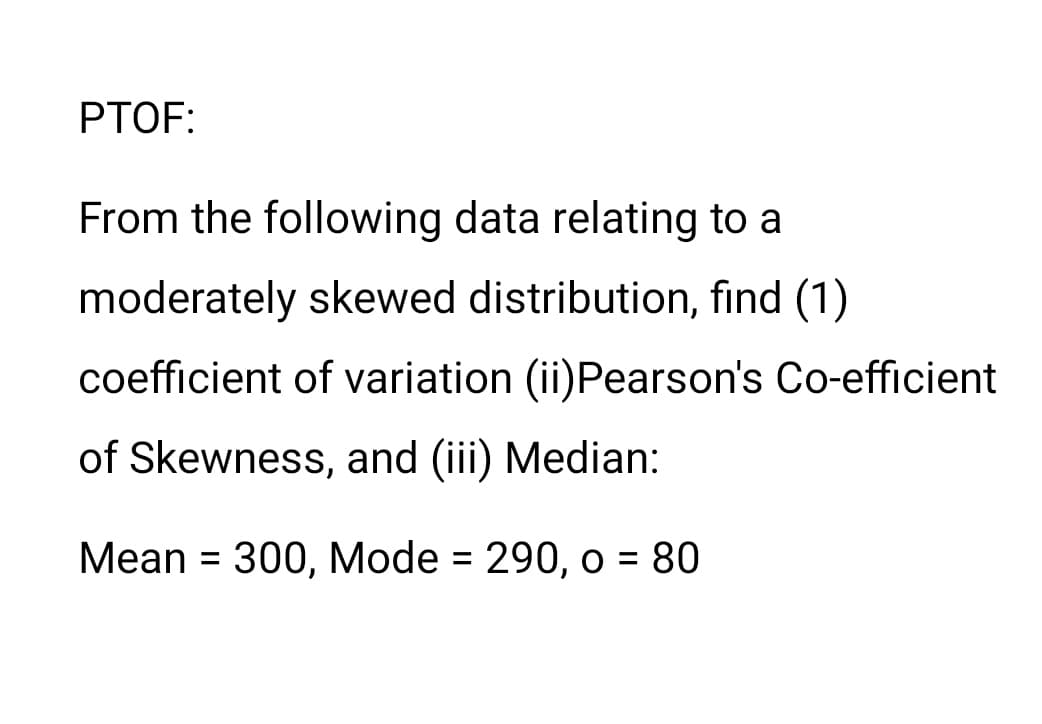
Transcribed Image Text:PTOF:
From the following data relating to a
moderately skewed distribution, find (1)
coefficient of variation (ii)Pearson's Co-efficient
of Skewness, and (iii) Median:
Mean = 300, Mode = 290, o = 80
%3D
Expert Solution
This question has been solved!
Explore an expertly crafted, step-by-step solution for a thorough understanding of key concepts.

Step by step
Solved in 4 steps with 4 images

Recommended textbooks for you
Glencoe Algebra 1, Student Edition, 9780079039897…
Algebra
ISBN:
9780079039897
Author:
Carter
Publisher:
McGraw Hill
Glencoe Algebra 1, Student Edition, 9780079039897…
Algebra
ISBN:
9780079039897
Author:
Carter
Publisher:
McGraw Hill