Independent Dependent Variable Variable 15 5 12 7 10 7 11 What is he least squares regression estimate of the intercept? a) -1.3 O b) 16.41176 c) 21.4 -7.647
Independent Dependent Variable Variable 15 5 12 7 10 7 11 What is he least squares regression estimate of the intercept? a) -1.3 O b) 16.41176 c) 21.4 -7.647

Linear Algebra: A Modern Introduction
4th Edition
ISBN:9781285463247
Author:David Poole
Publisher:David Poole
Chapter7: Distance And Approximation
Section7.3: Least Squares Approximation
Problem 5EQ

Related questions
Question
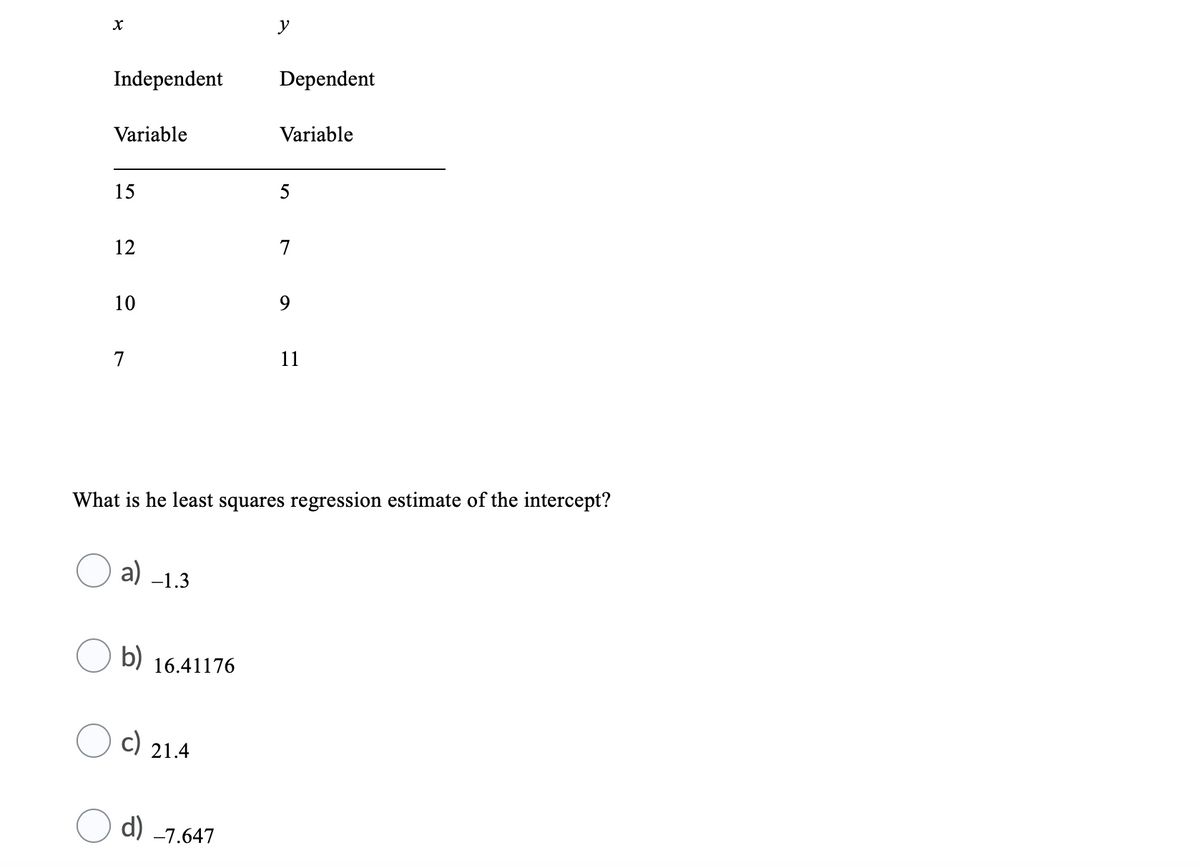
Transcribed Image Text:y
Independent
Dependent
Variable
Variable
15
12
7
10
9.
7
11
What is he least squares regression estimate of the intercept?
a) -1.3
b) 16.41176
c) 21.4
d) -7.647
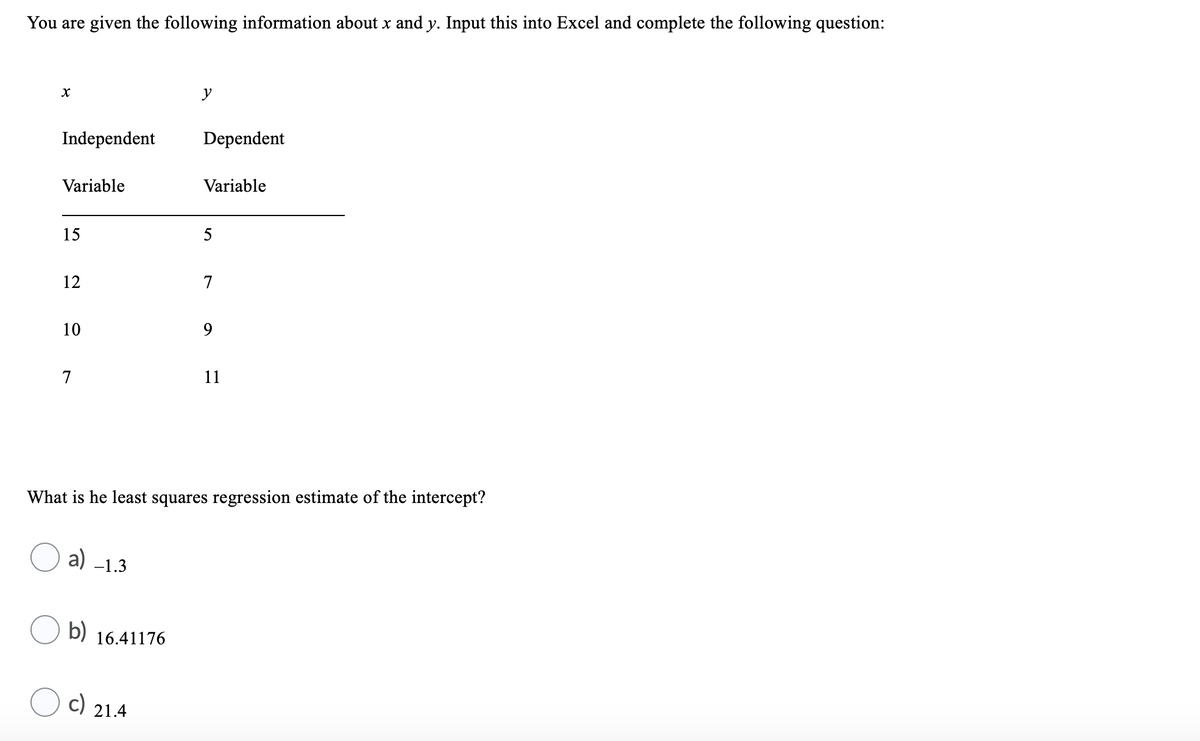
Transcribed Image Text:You are given the following information about x and y. Input this into Excel and complete the following question:
y
Independent
Dependent
Variable
Variable
15
5
12
10
9.
7
11
What is he least squares regression estimate of the intercept?
a) -1.3
b)
16.41176
c)
21.4
Expert Solution
This question has been solved!
Explore an expertly crafted, step-by-step solution for a thorough understanding of key concepts.

This is a popular solution!

Trending now
This is a popular solution!

Step by step
Solved in 2 steps with 1 images

Recommended textbooks for you
Linear Algebra: A Modern Introduction
Algebra
ISBN:
9781285463247
Author:
David Poole
Publisher:
Cengage Learning

Functions and Change: A Modeling Approach to Coll…
Algebra
ISBN:
9781337111348
Author:
Bruce Crauder, Benny Evans, Alan Noell
Publisher:
Cengage Learning

Algebra & Trigonometry with Analytic Geometry
Algebra
ISBN:
9781133382119
Author:
Swokowski
Publisher:
Cengage
Linear Algebra: A Modern Introduction
Algebra
ISBN:
9781285463247
Author:
David Poole
Publisher:
Cengage Learning
Functions and Change: A Modeling Approach to Coll…
Algebra
ISBN:
9781337111348
Author:
Bruce Crauder, Benny Evans, Alan Noell
Publisher:
Cengage Learning
Algebra & Trigonometry with Analytic Geometry
Algebra
ISBN:
9781133382119
Author:
Swokowski
Publisher:
Cengage

Elementary Linear Algebra (MindTap Course List)
Algebra
ISBN:
9781305658004
Author:
Ron Larson
Publisher:
Cengage Learning