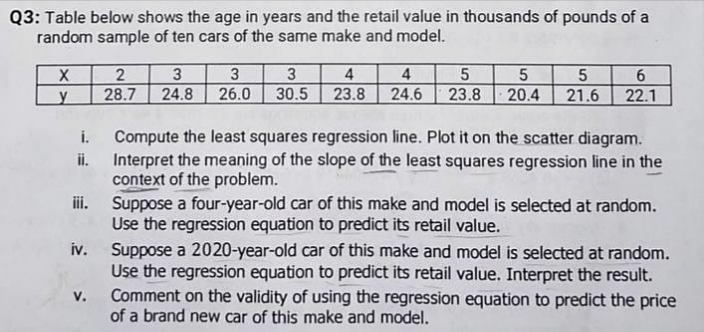
Q3: Table below shows the age in years and the retail value in thousands of pounds of a random sample of ten cars of the same make and model. 3 24.8 4. 24.6 3 3 4 6. 28.7 26.0 30.5 23.8 23.8 20.4 21.6 22.1 i. Compute the least squares regression line. Plot it on the scatter diagram. ii. Interpret the meaning of the slope of the least squares regression line in the context of the problem. iii. Suppose a four-year-old car of this make and model is selected at random. Use the regression equation to predict its retail value. iv. Suppose a 2020-year-old car of this make and model is selected at random. Use the regression equation to predict its retail value. Interpret the result. Comment on the validity of using the regression equation to predict the price of a brand new car of this make and model. v.
Q3: Table below shows the age in years and the retail value in thousands of pounds of a random sample of ten cars of the same make and model. 3 24.8 4. 24.6 3 3 4 6. 28.7 26.0 30.5 23.8 23.8 20.4 21.6 22.1 i. Compute the least squares regression line. Plot it on the scatter diagram. ii. Interpret the meaning of the slope of the least squares regression line in the context of the problem. iii. Suppose a four-year-old car of this make and model is selected at random. Use the regression equation to predict its retail value. iv. Suppose a 2020-year-old car of this make and model is selected at random. Use the regression equation to predict its retail value. Interpret the result. Comment on the validity of using the regression equation to predict the price of a brand new car of this make and model. v.

Linear Algebra: A Modern Introduction
4th Edition
ISBN:9781285463247
Author:David Poole
Publisher:David Poole
Chapter7: Distance And Approximation
Section7.3: Least Squares Approximation
Problem 31EQ

Related questions
Question
Transcribed Image Text:Q3: Table below shows the age in years and the retail value in thousands of pounds of a
random sample of ten cars of the same make and model.
4
4
5
20.4
2
28.7
24.8
26.0
30.5
23.8
24.6
23.8
21.6
22.1
i.
Compute the least squares regression line. Plot it on the scatter diagram.
Interpret the meaning of the slope of the least squares regression line in the
context of the problem.
Suppose a four-year-old car of this make and model is selected at random.
Use the regression equation to predict its retail value.
i.
ii.
iv.
Suppose a 2020-year-old car of this make and model is selected at random.
Use the regression equation to predict its retail value. Interpret the result.
Comment on the validity of using the regression equation to predict the price
of a brand new car of this make and model.
V.
Expert Solution
This question has been solved!
Explore an expertly crafted, step-by-step solution for a thorough understanding of key concepts.

Step by step
Solved in 2 steps with 1 images

Recommended textbooks for you
Linear Algebra: A Modern Introduction
Algebra
ISBN:
9781285463247
Author:
David Poole
Publisher:
Cengage Learning

Glencoe Algebra 1, Student Edition, 9780079039897…
Algebra
ISBN:
9780079039897
Author:
Carter
Publisher:
McGraw Hill
Linear Algebra: A Modern Introduction
Algebra
ISBN:
9781285463247
Author:
David Poole
Publisher:
Cengage Learning
Glencoe Algebra 1, Student Edition, 9780079039897…
Algebra
ISBN:
9780079039897
Author:
Carter
Publisher:
McGraw Hill