tamin Din 88 chadren whe live in a northem state was measured, and the sampte proportion who were not defcent 1-sample test for a single preportion N Null value Sample proportion se of sample propertion Results 88 0.5 .602 Test for 1 preportion (1 sided, greater than): Vakue192
tamin Din 88 chadren whe live in a northem state was measured, and the sampte proportion who were not defcent 1-sample test for a single preportion N Null value Sample proportion se of sample propertion Results 88 0.5 .602 Test for 1 preportion (1 sided, greater than): Vakue192

MATLAB: An Introduction with Applications
6th Edition
ISBN:9781119256830
Author:Amos Gilat
Publisher:Amos Gilat
Chapter1: Starting With Matlab
Section: Chapter Questions
Problem 1P

Related questions
Question
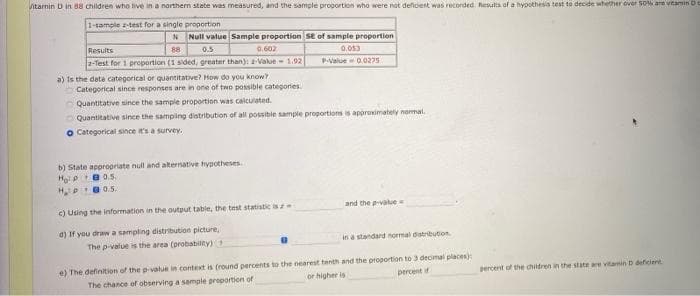
Transcribed Image Text:itanin D in 88 children who live in a northern state was measured, and the sample progortion who were not deficient was recorded. Results of a hypothesis test to decide whether over SON are vitamin D
1-tample z-test for a single proportion
Null value Sample proportion SE of sample proportion
0.602
Results
88
0.5
0.053
2-Test for 1 proportion (1 sided, greater than): -Vakue- 1.92
a) Is the date categorical or quantitative? How do you know
Categorical since responses are in one of two possible categories.
PValue- 0.0275
Quantitative since the sample proportion was calculated.
O Quantitative since the sampling distribution of all possibie sample proportions is approximately normal.
O Categorical since t's a survey.
b) State appropriate null and alternative hypotheses.
Hoi B0.5.
HPe0.5.
c) Using the information in the output table, the test statistic isz
and the -value
0) If you draw a sampling distribution picture,
in a standard normal distribution
The p-value is the area (probabilty)
e) The definition of the p-value in context is (round percents to the nearest tenth and the proportion to 3 decimal places)
percent if
percent of the children in the state are vitamin D deficient
or higher is
The chance of observing a sample proportion of
Expert Solution
This question has been solved!
Explore an expertly crafted, step-by-step solution for a thorough understanding of key concepts.

Step by step
Solved in 2 steps

Recommended textbooks for you
MATLAB: An Introduction with Applications
Statistics
ISBN:
9781119256830
Author:
Amos Gilat
Publisher:
John Wiley & Sons Inc

Probability and Statistics for Engineering and th…
Statistics
ISBN:
9781305251809
Author:
Jay L. Devore
Publisher:
Cengage Learning

Statistics for The Behavioral Sciences (MindTap C…
Statistics
ISBN:
9781305504912
Author:
Frederick J Gravetter, Larry B. Wallnau
Publisher:
Cengage Learning
MATLAB: An Introduction with Applications
Statistics
ISBN:
9781119256830
Author:
Amos Gilat
Publisher:
John Wiley & Sons Inc
Probability and Statistics for Engineering and th…
Statistics
ISBN:
9781305251809
Author:
Jay L. Devore
Publisher:
Cengage Learning
Statistics for The Behavioral Sciences (MindTap C…
Statistics
ISBN:
9781305504912
Author:
Frederick J Gravetter, Larry B. Wallnau
Publisher:
Cengage Learning

Elementary Statistics: Picturing the World (7th E…
Statistics
ISBN:
9780134683416
Author:
Ron Larson, Betsy Farber
Publisher:
PEARSON

The Basic Practice of Statistics
Statistics
ISBN:
9781319042578
Author:
David S. Moore, William I. Notz, Michael A. Fligner
Publisher:
W. H. Freeman

Introduction to the Practice of Statistics
Statistics
ISBN:
9781319013387
Author:
David S. Moore, George P. McCabe, Bruce A. Craig
Publisher:
W. H. Freeman